
Page 44 - The Petroleum System From Source to Trap
P. 44
36 Smith
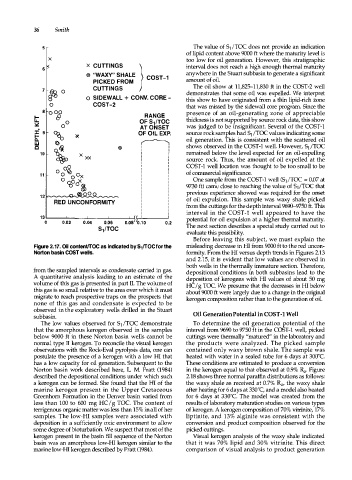
5 The value of S1 /TOC does not provide an indication
of lipid content above 9000 ft where the maturity level is
X too low for oil generation. However, this stratigraphic
x CUTTINGS interval does not reach a high enough thermal maturity
6
0 "WAXY" SHALE } COST-1 anywhere in the Stuart subbasin to generate a significant
amount of oil.
o PICKED FROM The oil show at 11,825-11,830 ft in the COST-2 well
CUTTINGS
7 16 o SIDEWALL + CONV. CORE this show to have originated from a thin lipid-rich zone
demonstrates that some oil was expelled. We interpret
0
8 oo COST-2 that was missed by the sidewall core program. Since the
o
RANGE
t:: r9 0 OF S /TOC presence of an oil-generating zone of appreciable
thickness is not supported by source rock data, this show
1
::.::: 0 AT ONSET was judged to be insignificant. Several of the COST-1
::z::: 9 OF OIL EXP. source rock samples had S1 /TOC values indicating some
1- % 0 *
a. oil generation. This is consistent with the scattered oil
w �
� X XX I I source rock. Thus, the amount of oil expelled at the
c ((2)� I I shows observed in the COST-1 well. However, S1 /TOC
1 0 I remained below the level expected for an oil-expelling
I I COST-1 well location was thought to be too small to be
I
1 1 I I of commercial significance.
I One sample from the COST-1 well (S1 /TOC = 0.07 at
I
I 9730 ft) came close to reaching the value of S1/TOC that
I
I
I previous experience showed was required for the onset
I
I of oil expulsion. This sample was waxy shale picked
I
I from the cuttings for the depth interval 9690-9750 ft. This
I
I interval in the COST-1 well appeared to have the
13 � -- � -- -- � -- -- � -- -- �r � ��-- -- -- � potential for oil expulsion at a higher thermal maturity.
0 0.02 0.04 0.06 0.08 0.10 0.2
S 1 /TOC The next section describes a special study carried out to
evaluate this possibility.
Before leaving this subject, we must explain the
Figure 2.17. Oil content!TOC as indicated by S1!TOC for the misleading decrease in HI from 9000 ft to the red uncon
Norton basin COST wells. formity. From the HI versus depth trends in Figures 2.13
and 2.15, it is evident that low values are observed in
both wells in the thermally immature section. Therefore,
from the sampled intervals as condensate carried in gas. depositional conditions in both subbasins lead to the
A quantitative analysis leading to an estimate of the deposition of kerogens with HI values of about 50 mg
volume of this gas is presented in part n. The volume of HC/g TOC. We presume that the decreases in HI below
this gas is so small relative to the area over which it must about 9000 ft were largely due to a change in the original
migrate to reach prospective traps on the prospects that kerogen composition rather than to the generation of oil.
none of this gas and condensate is expected to be
observed in the exploratory wells drilled in the Stuart
subbasin. Oil Generation Potential in COST-1 Well
The low values observed for S1 /TOC demonstrate To determine the oil generation potential of the
that the amorphous kerogen observed in the samples interval from %90 to 9750 ft in the COST -1 well, picked
below 9000 ft in these Norton basin wells cannot be cuttings were thermally "matured" in the laboratory and
normal type ll kerogen. To reconcile the visual kerogen the products were analyzed. The picked sample
observations with the Rock-Eva! pyrolysis data, one can contained only waxy brown shale. The sample was
postulate the presence of a kerogen with a low HI that heated with water in a sealed tube for 6 days at 300'C.
has a low capacity for oil generation. Subsequent to the These conditions are estimated to produce a conversion
Norton basin work described here, L. M. Pratt (1984) in the kerogen equal to that observed at 0.9% Rc,. Figure
described the depositional conditions under which such 2.18 shows three normal paraffin distributions as follows:
a kerogen can be formed. She found that the HI of the the waxy shale as received at 0.7% Rc,, the waxy shale
marine kerogen present in the Upper Cretaceous after heating for 6 days at 330'C, and a model also heated
Greenhorn Formation in the Denver basin varied from for 6 days at 330'C. The model was created from the
less than 1 0 0 to 600 mg HC /g TOC. The content of results of laboratory maturation studies on various types
terrigenous organic matter was less than 15% in all of her of kerogen. A kerogen composition of 70% vitrinite, 17%
samples. The low-HI samples were associated with liptinite, and 1 3 % alginite was consistent with the
deposition in a sufficiently oxic environment to allow conversion and product composition observed for the
some degree of bioturbation. We suspect that most of the picked cuttings.
kerogen present in the basin fill sequence of the Norton Visual kerogen analysis of the waxy shale indicated
basin was an amorphous low-HI kerogen similar to the that it was 70% lipid and 30% vitrinite. This direct
marine low-HI kerogen described by Pratt (1984). comparison of visual analysis to product generation