
Page 42 - The Petroleum System From Source to Trap
P. 42
34 Smith
HYDROGEN CUTIINGS
:J: KEROGEN I N DEX GAS
u
He (mg) WETNESS
0 TOC (wt. %) TYPE roc g
a.
w 0 1 0 6 1 2 0 1 0.5 1 5 10 % %
0 0 50 100 0 100 200 300 0 50 1 0 0
0 0 � � 0 .------,----..-....---,
0
0
3 0 0 � 8
�
2
0
� 0
( t:B o o o o ( OAI
o
4 00
OEf' o 6' 0 0
0
� oP
s
5 0 0 0
0
"'
o O
w 1- 6 0 o o\ 0
z u.. 0��
0 0
w dl 0 'I> 0
u � 7 a � J o C OAI
c)oAt
0 ::t "'' 0 c q, Q 0 0
(!) 0 0
�I
::::; b: 8 0 0
0 ll
0
w 0 -:'il
c 9 o I oO
g I
10 n 0 0 � ..
11 I I I 0 � 0
f5i;� 0
0 0
12 0 "'" 0 '1,0
0 0 .,Ja oo C O A�
t 0 0 8
13 0
14 a 8 1(,0 c9
15
o ROBERTSON RESEARCH(U.S.)
DATA FROM OCS REPORT MMS 86003
*·----* CALCULATED BY SHELL DEVELOPMENT
C] V ITR. ROBERTSON RESEARCH(U.S.)
llii iNERT. OCS REPORT MMS 86003
Figure 2.14. Vitrinite reflectance (R0) and total organic
carbon (TOC) for the COST-2 well in the Stuart subbasin.
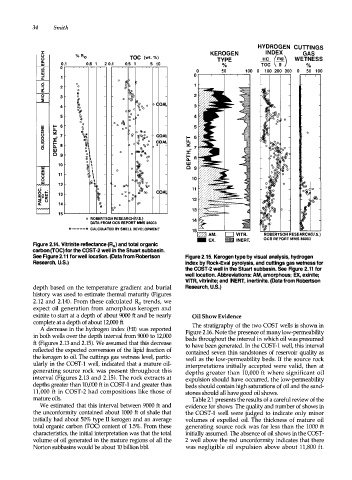
See Figure 2.11 for well location. (Data from Robertson Figure 2.15. Kerogen type by visual analysis, hydrogen
Research, U.S.) index by Rock-Eval pyrolysis, and cuttings gas wetness for
the COST-2 well in the Stuart subbasin. See Figure 2.11 for
well location. Abbreviations: AM, amorphous; EX, exinite;
VITA, vitrinite; and INERT, inertinite. (Data from Robertson
depth based on the temperature gradient and burial Research, U.S.)
history was used to estimate thermal maturity (Figures
2.12 and 2.1 4 ). From these calculated R0 trends, we
expect oil generation from amorphous kerogen and
exinite to start at a depth of about 9000 ft and be nearly Oil Show Evidence
complete at a depth of about 12,000 ft. The stratigraphy of the two COST wells is shown in
A decrease in the hydrogen index (HI) was reported Figure 2.16. Note the presence of many low-permeability
in both wells over the depth interval from 9000 to 12,000 beds throughout the interval in which oil was presumed
ft (Figures 2.13 and 2.15). We assumed that this decrease to have been generated. In the COST-1 well, this interval
reflected the expected conversion of the lipid fraction of contained seven thin sandstones of reservoir quality as
the kerogen to oil. The cuttings gas wetness level, partic well as the low-permeability beds. If the source rock
ularly in the COST-1 well, indicated that a mature oil interpretations initially accepted were valid, then at
generating source rock was present throughout this depths greater than 10,000 ft where significant oil
interval (Figures 2.13 and 2.15). The rock extracts at expulsion should have occurred, the low-permeability
depths greater than 10,000 ft in COST-1 and greater than beds should contain high saturations of oil and the sand
1 1 , 000 ft in COST-2 had compositions like those of stones should all have good oil shows.
mature oils. Table 2.1 presents the results of a careful review of the
We estimated that this interval between 9000 ft and evidence for shows. The quality and number of shows in
the unconformity contained about 1000 ft of shale that the COST-I well were judged to indicate only minor
initially had about 50% type II kerogen and an average volumes of expelled oil. The thickness of mature oil
total organic carbon (TOC) content of 1.5%. From these generating source rock was far less than the 1000 ft
characteristics, the initial interpretation was that the total initially assumed. The absence of oil shows in the COST-
volume of oil generated in the mature regions of all the 2 well above the red unconformity indicates that there
Norton subbasins would be about 10 billion bbl. was negligible oil expulsion above about 1 1 ,800 ft.