
Page 49 - The Petroleum System From Source to Trap
P. 49
2. Petroleum System Logic as an Exploration Tool 41
RESISTIVITY SONIC DENSITY subbasin area. For these conditions, we estimated that
2
ohms m /m microseconds/ft. grams/cc 1 . 0% Ro would be reached at 13,000 ft, and since the base
0 of the basin fill was estimated to reach 14,500 ft, the
maximum thickness of the gas-expelling section of basin
fill rocks was 1500 ft.
We developed a source rock model for this lower 1500
ft of the basin fill sequence. The data in Figures 2.14, 2.15,
and 2.17 were used to derive the following quantities for
our model: an average TOC of 1.5 wt. % , an average HI
C5:2 peak) of 120 mg HC/g TOC, and an average distill
able yield (S 1 peak) of 20 mg HC/ g TOC. From these
values, the total hydrocarbon yield on complete conver
sion was found to be 2.1 x l 0 -3 g HC/g rock. If we
assume that this total yield is obtained as gas, the yield
1
would be 1.7 x 101 SCF/mi2 for a 1000-ft-thick layer of
source rock. The maximum vitrinite reflectance reached
at the base of the basin fill sequence is estimated to be
1.2%. At 1.2% Ro about 7% of the total potential gas yield
is expelled (Figure 2.9). Under these maximum condi
tions, the average value of the gas yield over the entire
1500-ft sequence is about 3.5% of the total potential.
Thus, the estimated gas yield from the basin fill sequence
where it attains maximum burial depth and thus
maximum thermal mahtrity is only 9 x 10⁹ SCF I mi2.
The total area over which the depth of the red event is
greater than 13,000 ft is approximately 42 mi2. We
estimate that the total volume of gas expelled from the
� basin fill source rock in the Stuart subbasin is about 120 x
BASEMENT -� 1 0 9 SCF, assuming the average yield from the gas
expelling area is 3 x 10⁹ SCF/mi2.
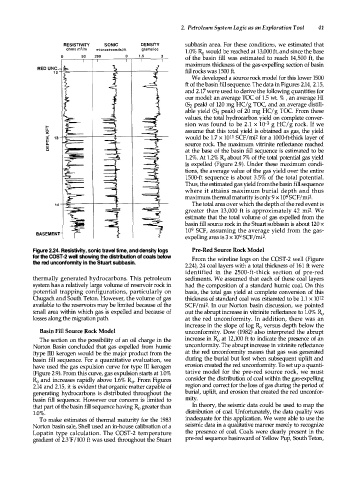
Figure 2.24. Resistivity, sonic travel time, and density logs Pre-Red Source Rock Model
for the COST-2 well showing the distribution of coals below From the wireline logs on the COST-2 well (Figure
the red unconformity in the Stuart subbasin.
2.24), 24 coal layers with a total thickness of 161 ft were
identified in the 2500-ft-thick section of pre-red
thermally generated hydrocarbons. This petroleum sediments. We assumed that each of these coal layers
system has a relatively large volume of reservoir rock in had the composition of a standard humic coal. On this
potential trapping configurations, particularly on basis, the total gas yield at complete conversion of this
Chugach and South Teton. However, the volume of gas thickness of standard coal was estiamted to be 1.1 x 10¹²
available to the reservoirs may be limited because of the SCF /mi2. In our Norton basin discussion, we pointed
small area within which gas is expelled and because of out the abrupt increase in vitrinite reflectance to 1.0% Ro
losses along the migration path. at the red unconformity. In addition, there was an
increase in the slope of log Ro versus depth below the
Basin Fill Source Rock Model unconformity. Dow (1982) also interpreted the abrupt
The section on the possibility of an oil charge in the increase in Ro at 12,100 ft to indicate the presence of an
Norton Basin concluded that gas expelled from humic unconformity. The abrupt increase in vitrinite reflectance
(type III) kerogen would be the major product from the at the red unconformity means that gas was generated
basin fill sequence. For a quantitative evaluation, we during the burial but lost when subsequent uplift and
have used the gas expulsion curve for type III kerogen erosion created the red unconformity. To set up a quanti
(Figure 2.9). From this curve, gas expulsion starts at 1.0% tative model for the pre-red source rock, we must
Ro and increases rapidly above 1.6% Ro. From Figures consider the distribution of coal within the gas-expelling
2.14 and 2.15, it is evident that organic matter capable of region and correct for the loss of gas during the period of
generating hydrocarbons is distributed throughout the burial, uplift, and erosion that created the red unconfor
basin fill sequence. However our concern is limited to mity.
that part of the basin fill sequence having Ro greater than In theory, the seismic data could be used to map the
1.0%. distribution of coal. Unfortunately, the data quality was
To make estimates of thermal maturity for the 1983 inadequate for this application. We were able to use the
Norton basin sale, Shell used an in-house calibration of a seismic data in a qualitative manner merely to recognize
Lopatin type calculation. The COST-2 temperature the presence of coal. Coals were clearly present in the
gradient of 2.3'F/100 ft was used throughout the Stuart pre-red sequence basinward of Yellow Pup, South Teton,