
Page 53 - The Petroleum System From Source to Trap
P. 53
2. Petroleum System Logic as an Exploration Tool 45
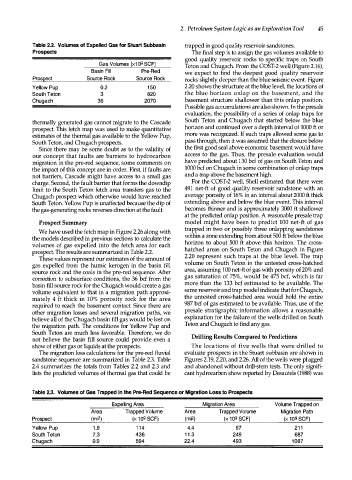
Table 2.2. Volumes of Expelled Gas for Stuart Subbasin trapped in good quality reservoir sandstones.
Prospects The final step is to assign the gas volumes available to
good quality reservoir rocks to specific traps on South
Gas Volumes (x1 Q9 SCF) Teton and Chugach. From the COST-2 well (Figure 2.16),
Basin Fill Pre-Red we expect to find the deepest good quality reservoir
Prospect Source Rock Source Rock rocks slightly deeper than the blue seismic event. Figure
Yellow Pup 0.2 150 2.20 shows the structure at the blue level, the locations of
South Teton 3 820 the blue horizon onlap on the basement, and the
Chugach 36 2070 basement structure shallower than this onlap position.
Possible gas accumulations are also shown. In the presale
evaluation, the possibility of a series of onlap traps for
thermally generated gas cannot migrate to the Cascade South Teton and Chugach that started below the blue
prospect. This fetch map was used to make quantitative horizon and continued over a depth interval of 1000 ft or
estimates of the thermal gas available to the Yellow Pup, more was recognized. If such traps allowed some gas to
South Teton, and Chugach prospects. pass through, then it was assumed that the closure below
Since there may be some doubt as to the validity of the first good seal above economic basement would have
our concept that faults are barriers to hydrocarbon access to the gas. Thus, the presale evaluation would
migration in the pre-red sequence, some comments on have predicted about 130 bcf of gas on South Teton and
the impact of this concept are in order. First, if faults are 1000 be£ on Chugach in some combination of onlap traps
not barriers, Cascade might have access to a small gas and a trap above the basement high.
charge. Second, the fault barrier that forms the downdip For the COST-2 well, Shell estimated that there were
limit to the South Teton fetch area transfers gas to the 491 net-ft of good quality reservoir sandstone with an
Chugach prospect which otherwise would have reached average porosity of 16% in an interval about 2000 ft thick
South Teton. Yellow Pup is unaffected because the dip of extending above and below the blue event. This interval
the gas-generating rocks reverses direction at the fault. becomes thinner and is approximately 3000 ft shallower
at the predicted onlap position. A reasonable presale trap
Prospect Summary model might have been to predict 100 net-ft of gas
trapped in two or possibly three onlapping sandstones
We have used the fetch map in Figure 2.26 along with
the models described in previous sections to calculate the within a zone extending from about 500 ft below the blue
volumes of gas expelled into the fetch area for each horizon to about 500 ft above this horizon. The cross
prospect. The results are summarized in Table 2.2. hatched areas on South Teton and Chugach in Figure
These values represent our estimates of the amount of 2.20 represent such traps at the blue level. The trap
gas expelled from the humic kerogen in the basin fill volume on South Teton in the untested cross-hatched
source rock and the coals in the pre-red sequence. After area, assuming 100 net-ft of gas with porosity of 20% and
correction to subsurface conditions, the 36 be£ from the gas saturation of 75%, would be 475 bcf, which is far
basin fill source rock for the Chugach would create a gas more than the 133 bcf estimated to be available. The
volume equivalent to that in a migration path approxi same reservoir and trap model indicate that for Chugach,
mately 4 ft thick in 10% porosity rock for the area the untested cross-hatched area would hold the entire
required to reach the basement contact. Since there are 987 be£ of gas estimated to be available. Thus, use of the
other migration losses and several migration paths, we presale stratigraphic information allows a reasonable
believe all of the Chugach basin fill gas would be lost on explanation for the failure of the wells drilled on South
the migration path. The conditions for Yellow Pup and Teton and Chugach to find any gas.
South Teton are much less favorable. Therefore, we do
not believe the basin fill source could provide even a Drilling Results Compared to Predictions
show of either gas or liquids at the prospects. The locations of five wells that were drilled to
The migration loss calculations for the pre-red fluvial evaluate prospects in the Stuart subbasin are shown in
sandstone sequence are summarized in Table 2.3. Table Figures 2.19, 2.20, and 2.26. All of the wells were plugged
2.4 summarizes the totals from Tables 2.2 and 2.3 and and abandoned without drill-stem tests. The only signifi
lists the predicted volumes of thermal gas that could be cant hydrocarbon show reported by Desautels (1988) was
Table 2.3. Volumes of Gas Trapped in the Pre-Red Sequence or Migration Loss to Prospects
Expelling Area Migration Area Volume Trapped on
Area Trapped Volume Area Trapped Volume Migration Path
Prospect (mi2) (x 109 SCF) (mi2) (x 109 SCF) (x 109 SCF)
Yellow Pup 1 . 9 1 1 4 4.4 97 211
South Teton 7.3 438 1 1 . 3 249 687
Chugach 9.9 594 22.4 493 1087