
Page 141 - The Six Sigma Project Planner
P. 141
Example of Using Worksheet
Refer to the output shown in Figure 22. Now, it would seem a simple matter to
conclude that females are shorter than males. And this certainly squares with our
perception of the world, making it even easier to jump to that particular conclusion.
Indeed, this is the sort of thing that is usually done in the business world. We have a
preconceived notion, collect some data that “confirm” our notion, and conclude:
1. We were right all along.
2. The data collection exercise was a waste of time.
3. We can continue “hip-shooting” our way to success.
The problem is that this retrospective approach to data analysis is inadequate as a way
racial or ethnic groups. TEAMFLY
to confirm hypotheses. Its purpose is to help us develop hypotheses. Here are only a few
reasons why we can’t conclude that the data in Figure 22 support the conclusion
without further analysis:
• Maybe the males and females were children of different ages.
• Maybe the males and females we’re interested in as customers are from different
populations than used in the “happenstance” sample.
• Maybe the males were of one racial or ethnic group and the females were of
another.
• Maybe the males and females we’re interested in as customers are from different
The list could go on and on. The point is, to confirm the hypotheses suggested by the
data, we must conduct another study in which we exercise a degree of control over the
sampling and/or the experiment.
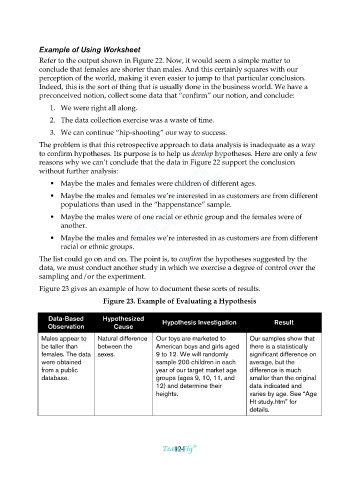
Figure 23 gives an example of how to document these sorts of results.
Figure 23. Example of Evaluating a Hypothesis
Data-Based Hypothesized Hypothesis Investigation Result
Observation Cause
Males appear to Natural difference Our toys are marketed to Our samples show that
be taller than between the American boys and girls aged there is a statistically
females. The data sexes. 9 to 12. We will randomly significant difference on
were obtained sample 200 children in each average, but the
from a public year of our target market age difference is much
database.
smaller than the original
groups (ages 9, 10, 11, and
12) and determine their data indicated and
heights. varies by age. See “Age
Ht study.htm” for
details.
®
Team-Fly
124