
Page 147 - The Six Sigma Project Planner
P. 147
are found for the lower and upper specifications using normal tables or software.
Finally, the combined process reject rate is used to determine the process RTY and
sigma level.
Perfect statistical control is not common. In practice, if control charts are in statistical
control for 90% of the time or more, then the process capability is approximated by
dropping the out-of-control groups from the calculations. However, this mathematical
trick should not be used unless the root causes of the out-of-control conditions have
been identified.
Example
The CTQ for a machining process is the diameter of a pin. The specifications call for the
diameter to be 1.000 ± 0.001 inches. A control chart shows statistical control for an entire
workweek. The average of the X-bar chart is 1.0001 inches and, based on the sigma
chart, the standard deviation is 0.0002 inches. What is the process capability sigma
level?
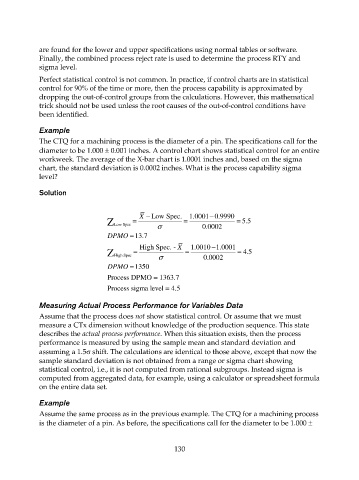
Solution
X − Low Spec. 1.0001 0.9990
−
Z Low Spec = σ = 0.0002 = 5.5
DPMO = 13.7
−
Z High Spec = High Spec. - X = 1.0010 1.0001 = 4.5
σ
0.0002
DPMO = 1350
Process DPMO = 1363.7
Process sigma level = 4.5
Measuring Actual Process Performance for Variables Data
Assume that the process does not show statistical control. Or assume that we must
measure a CTx dimension without knowledge of the production sequence. This state
describes the actual process performance. When this situation exists, then the process
performance is measured by using the sample mean and standard deviation and
assuming a 1.5σ shift. The calculations are identical to those above, except that now the
sample standard deviation is not obtained from a range or sigma chart showing
statistical control, i.e., it is not computed from rational subgroups. Instead sigma is
computed from aggregated data, for example, using a calculator or spreadsheet formula
on the entire data set.
Example
Assume the same process as in the previous example. The CTQ for a machining process
is the diameter of a pin. As before, the specifications call for the diameter to be 1.000 ±
130