
Page 148 - The Six Sigma Project Planner
P. 148
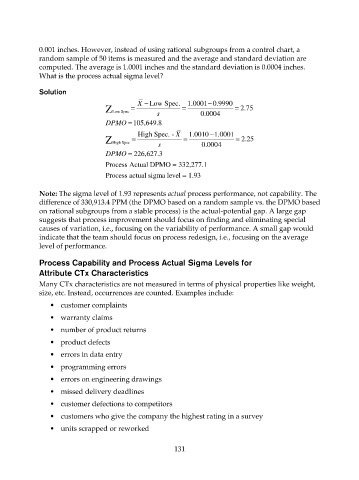
0.001 inches. However, instead of using rational subgroups from a control chart, a
                    random sample of 50 items is measured and the average and standard deviation are
                    computed. The average is 1.0001 inches and the standard deviation is 0.0004 inches.
                    What is the process actual sigma level?

                    Solution
                                                  X −  Low Spec. 1.0001 0.9990
                                                                       −
                                        Z  Low Spec  =         =               =  2.75
                                                       s            0.0004
                                        DPMO =  105,649.8
                                                                       −
                                        Z High Spec  =  High Spec. - X  =  1.0010 1.0001 =  2.25
                                                        s            0.0004
                                        DPMO =  226,627.3

                                        Process Actual DPMO = 332,277.1
                                        Process actual sigma level = 1.93

                    Note: The sigma level of 1.93 represents actual process performance, not capability. The
                    difference of 330,913.4 PPM (the DPMO based on a random sample vs. the DPMO based
                    on rational subgroups from a stable process) is the actual-potential gap. A large gap
                    suggests that process improvement should focus on finding and eliminating special
                    causes of variation, i.e., focusing on the variability of performance. A small gap would
                    indicate that the team should focus on process redesign, i.e., focusing on the average
                    level of performance.

                    Process Capability and Process Actual Sigma Levels for
                    Attribute CTx Characteristics
                    Many CTx characteristics are not measured in terms of physical properties like weight,
                    size, etc. Instead, occurrences are counted. Examples include:
                       •  customer complaints
                       •  warranty claims

                       •  number of product returns
                       •  product defects
                       •  errors in data entry

                       •  programming errors
                       •  errors on engineering drawings
                       •  missed delivery deadlines

                       •  customer defections to competitors
                       •  customers who give the company the highest rating in a survey
                       •  units scrapped or reworked


                                                             131