
Page 158 - The Six Sigma Project Planner
P. 158
worthwhile. Some years later, it acquired the company that had purchased the old
solder equipment. To their amazement, the old solder machine was 100 times better
than the new one! The defect rate was only 5 PPM, or nearly six sigma.
The lesson here is that we should do all that we can to optimize the existing process
before spending large sums of money for new technology. At this point in the project,
the Black Belt should review the data gathered previously to determine if DOE is
indicated. If so, the Black Belt should assemble the necessary personnel and conduct
DOEs to determine the optimal levels at which the process can be operated. DOE results
can be summarized in the tables on this and the following pages.
Perform Designed Experiments
At this time, conduct designed experiments to determine the optimum settings for the
process. Optimum settings are those that maximize the process yield, both overall and for
1
each CTx. Process optimization is generally conducted in five phases, as shown in Table 8.
At the completion of each phase, the team should compare the process performance with
the project’s goals. If the process is stable at a level that meets the project’s goals, determine
if the project should continue or if another project should be pursued instead.
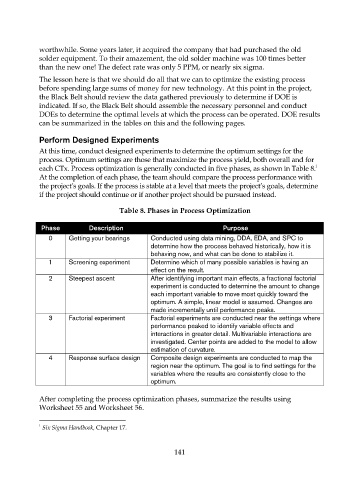
Table 8. Phases in Process Optimization
Phase Description Purpose
0 Getting your bearings Conducted using data mining, DDA, EDA, and SPC to
determine how the process behaved historically, how it is
behaving now, and what can be done to stabilize it.
1 Screening experiment Determine which of many possible variables is having an
effect on the result.
2 Steepest ascent After identifying important main effects, a fractional factorial
experiment is conducted to determine the amount to change
each important variable to move most quickly toward the
optimum. A simple, linear model is assumed. Changes are
made incrementally until performance peaks.
3 Factorial experiment Factorial experiments are conducted near the settings where
performance peaked to identify variable effects and
interactions in greater detail. Multivariable interactions are
investigated. Center points are added to the model to allow
estimation of curvature.
4 Response surface design Composite design experiments are conducted to map the
region near the optimum. The goal is to find settings for the
variables where the results are consistently close to the
optimum.
After completing the process optimization phases, summarize the results using
Worksheet 55 and Worksheet 56.
1
Six Sigma Handbook, Chapter 17.
141