
Page 75 - The engineering of chemical reactions
P. 75
Chemical Equilibrium 59
(Pj), mole fraction (xj), and concentration (Cj). For these units the standard state is defined
as unit activity aj, which is typically Pj = 1 atm and 298 K, or Xj = 1 for pure liquid at 1
atm and 298 K, or Cj = 1 mole/liter at 298 K, respectively. Students have seen the first two
of these for gases and liquids in thermodynamics. We will use concentration units wherever
possible in this course, and the natural standard state would be a 1 molar solution. However,
data are usually not available in this standard state, and therefore to calculate equilibrium
composition at any temperature and pressure, one usually does the calculation with Pj or
Xj and then converts to Cj .
As zfinal remark on the importance and use of thermodynamics in chemical reactors,
we note that the preceding equations no longer need be solved in practice because thermo-
dynamics computer programs and databases allow one to compute all these quantities by
simply listing the molecules and conditions into the computer programs. The data in Table 2-
2 were calculated using CHEMEQ from Sandler’s thermodynamics text, and sophisticated
chemical process programs such as ASPEN contain databases for most of the complex
molecules and conditions that one might encounter in industrial practice.
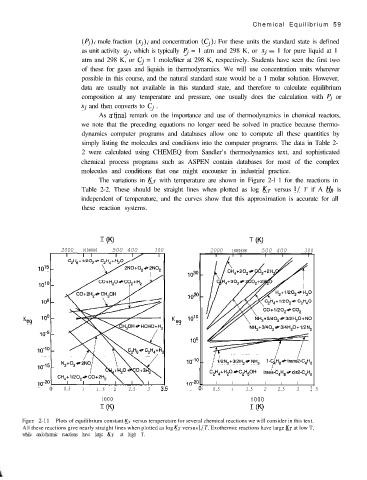
The variations in KT with temperature are shown in Figure 2-l 1 for the reactions in
Table 2-2. These should be straight lines when plotted as log KT versus l/ T if A HR is
independent of temperature, and the curves show that this approximation is accurate for all
these reaction systems.
T WI T WI
2000 1000800 500 400 300 2000 1000800 500 400 300
10'5
K K 10'0
eq eq
100
\
1/2N,+3/2H,+NH,
C,H,+H,O*C,H,OH trark-C,H8#cis2-C,H,
.- I I I I I I
0 0.5 1 1.5 2 2.5 3 3.5 0.5 1 1.5 2 2.5 3 : 5
1000 1000
T W) T (K)
Figure 2-11 Plots of equilibrium constant KT versus temperature for several chemical reactions we will consider in this text.
All these reactions give nearly straight lines when plotted as log KT versus l/ 7’. Exothermic reactions have large KT at low T,
while endothermic reactions have large KT at high T.