
Page 210 -
P. 210
10: Green IT Case Studies for Universities and a Large Company 175
0.70
1-Way: Mean 2-Way: Mean 4-Way: Mean
0.59
0.60 0.52
Fraction of 1500 Systems 0.40 0.46
0.50
0.30
0.19
0.17
0.20
0.17
0.10 0.10
0.10 0.07 0.06
0.04 0.05 0.03 0.04 0.06 0.02 0.03 0.05 0.01 0.02 0.03 0.01 0.02 0.02 0.01 0.01 0.02 0.01
0.00 0.00 0.01 0.00 0.01 0.01 0.01 0.00 0.01 0.01 0.00 0.00 0.00 0.00 0.00 0.00 0.00 0.00 0.00 0.00 0.00 0.00 0.00 0.00 0.00 0.00 0.00 0.00 0.00 0.00 0.00 0.01 0.00
0-5 5-10 10-15 15-20 20-25 25-30 30-35 35-40 40-45 45-50 50-55 55-60 60-65 65-70 70-75 75-80 80-85 85-90 90-95 95-100
Utilization Range Bin
Source: IBM Green Data Center
ptg
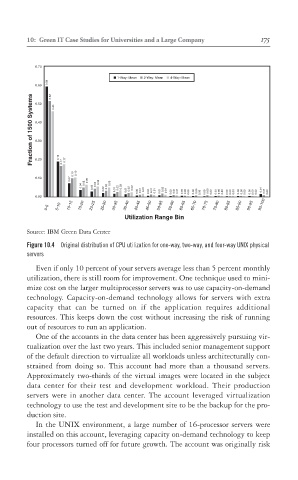
Figure 10.4 Original distribution of CPU utilization for one-way, two-way, and four-way UNIX physical
servers
Even if only 10 percent of your servers average less than 5 percent monthly
utilization, there is still room for improvement. One technique used to mini-
mize cost on the larger multiprocessor servers was to use capacity-on-demand
technology. Capacity-on-demand technology allows for servers with extra
capacity that can be turned on if the application requires additional
resources. This keeps down the cost without increasing the risk of running
out of resources to run an application.
One of the accounts in the data center has been aggressively pursuing vir-
tualization over the last two years. This included senior management support
of the default direction to virtualize all workloads unless architecturally con-
strained from doing so. This account had more than a thousand servers.
Approximately two-thirds of the virtual images were located in the subject
data center for their test and development workload. Their production
servers were in another data center. The account leveraged virtualization
technology to use the test and development site to be the backup for the pro-
duction site.
In the UNIX environment, a large number of 16-processor servers were
installed on this account, leveraging capacity on-demand technology to keep
four processors turned off for future growth. The account was originally risk