
Page 207 -
P. 207
The Greening of IT
172 How Companies Can Make a Difference for the Environment
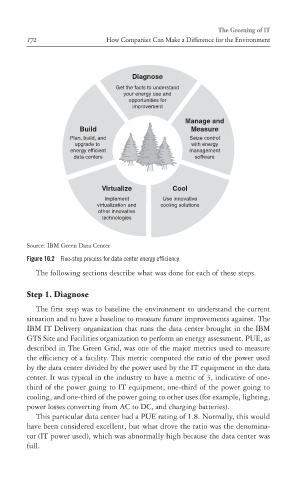
Diagnose
Get the facts to understand
your energy use and
opportunities for
improvement
Manage and
Build Measure
Plan, build, and Seize control
upgrade to with energy
energy efficient management
data centers software
Virtualize Cool
Implement Use innovative
virtualization and cooling solutions
other innovative
technologies
ptg
Source: IBM Green Data Center
Figure 10.2 Five-step process for data center energy efficiency
The following sections describe what was done for each of these steps.
Step 1. Diagnose
The first step was to baseline the environment to understand the current
situation and to have a baseline to measure future improvements against. The
IBM IT Delivery organization that runs the data center brought in the IBM
GTS Site and Facilities organization to perform an energy assessment. PUE, as
described in The Green Grid, was one of the major metrics used to measure
the efficiency of a facility. This metric computed the ratio of the power used
by the data center divided by the power used by the IT equipment in the data
center. It was typical in the industry to have a metric of 3, indicative of one-
third of the power going to IT equipment, one-third of the power going to
cooling, and one-third of the power going to other uses (for example, lighting,
power losses converting from AC to DC, and charging batteries).
This particular data center had a PUE rating of 1.8. Normally, this would
have been considered excellent, but what drove the ratio was the denomina-
tor (IT power used), which was abnormally high because the data center was
full.