
Page 1048 - The Mechatronics Handbook
P. 1048
An alternate way of subdividing the space for the two-variable case is illustrated in Fig. 36.11 and labeling
alternatives in Fig. 36.12. The configuration employed in Fig. 36.9 uses two dimensions for two variables,
whereas the configuration employed in Fig. 36.11 uses one-dimension for two variables. The two-dimensional
configuration appears to be more logical and is more convenient to use than the one-dimensional configuration
for the case of two variables. For the case of a larger number of variables the configuration in Fig. 36.12 offers
special advantages, as will be shown.
The organization of three-variable K-map formats is illustrated in Fig. 36.13. It is logical to introduce
an additional space dimension for each additional independent variable as depicted in Fig. 36.13(a);
however, the excessive inconvenience of working with such formats makes them impractical. To make
the mapping process practical it must be laid out in two dimensions. This can be done in two ways. One
way is to take the individual slices of the three-dimensional configuration and place them adjacent to
each other as illustrated in Fig. 36.13(b). Another way is to use the one-dimensional form for two
variables, illustrated in Fig. 36.12, as shown in Fig. 36.13(c). For the case of three and four independent
variables the format given in Fig. 36.13(c) is more convenient and for further independent variables that
of Fig. 36.13(b) is convenient. These are all illustrated in Fig. 36.15. Labeling for three independent
variables is given in Fig. 36.14.
The independent boolean variables in conformal coordinate scales have exactly the same order
as in the boolean function argument list, as depicted in Fig. 36.15. Conformal assignment of the
independent variables to the K-map coordinate scales makes the catenated position coordinates for
a minterm (or maxterm) identical to the minterm (or max-term) number. Utilization of this identity
eliminates the need for the placement of minterm identification numbers in each square or for a
separate position identification table. This significantly decreases the time required to construct K-
maps and makes their construction less error prone. The minterm number, given by the catenation
of the vertical and horizontal coordinate numbers, is obvious if the binary or octal number system
is used.
36.17 K-Maps and Minimization
A function is mapped into the K-map format by entering the value for each of the minterms in the space
for that minterm. The function values can be obtained in various ways such as from the truth table for
the function, the Boolean expression for the function, or from other means by which the function may
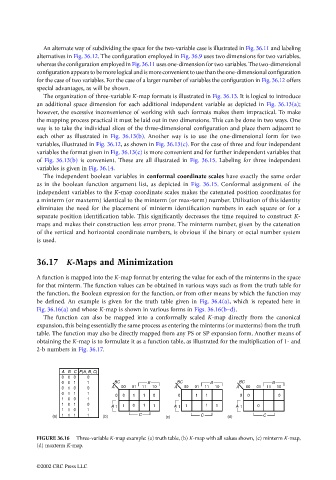
be defined. An example is given for the truth table given in Fig. 36.4(a), which is repeated here in
Fig. 36.16(a) and whose K-map is shown in various forms in Figs. 36.16(b–d).
The function can also be mapped into a conformally scaled K-map directly from the canonical
expansion, this being essentially the same process as entering the minterms (or maxterms) from the truth
table. The function may also be directly mapped from any PS or SP expansion form. Another means of
obtaining the K-map is to formulate it as a function table, as illustrated for the multiplication of 1- and
2-b numbers in Fig. 36.17.
A B C F(A, B, C)
0 0 0 0
0 0 1 1 BC B BC B BC B
0 1 0 0 A 00 01 11 10 A 00 01 11 10 A 00 01 11 10
0 1 1 1
0 0 1 1 0 0 1 1 0 0 0
1 0 0 1
1 0 1 0 A 1 1 0 1 1 A 1 1 1 1 A 1 0
1 1 0 1 1 C C C
1 1 1
(a) (b) (c) (d)
FIGURE 36.16 Three-variable K-map example: (a) truth table, (b) K-map with all values shown, (c) minterm K-map,
(d) maxterm K-map.
©2002 CRC Press LLC