
Page 1045 - The Mechatronics Handbook
P. 1045
a
a t
t
b
t
b
t
t 1 + t 2
x = a v b
t
x = a v b
t
a z t 3
x 3 t 3 t 1 + t 2
2 z = a v x
b t 3 t
t 1 x = a v x
(a) t 2 (b) t (c) HAZARD
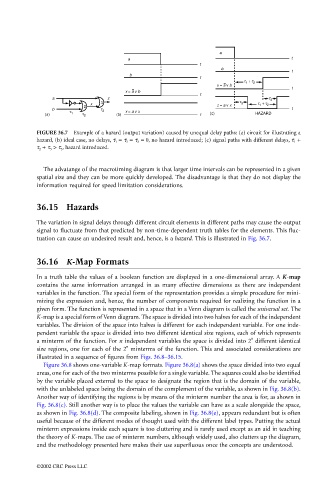
FIGURE 36.7 Example of a hazard (output variation) caused by unequal delay paths: (a) circuit for illustrating a
hazard, (b) ideal case, no delays, τ 1 = τ 2 = τ 3 = 0, no hazard introduced; (c) signal paths with different delays, τ 1 +
τ 2 + τ 3 > τ 3 , hazard introduced.
The advatange of the macrotiming diagram is that larger time intervals can be represented in a given
spatial size and they can be more quickly developed. The disadvantage is that they do not display the
information required for speed limitation considerations.
36.15 Hazards
The variation in signal delays through different circuit elements in different paths may cause the output
signal to fluctuate from that predicted by non-time-dependent truth tables for the elements. This fluc-
tuation can cause an undesired result and, hence, is a hazard. This is illustrated in Fig. 36.7.
36.16 K-Map Formats
In a truth table the values of a boolean function are displayed in a one-dimensional array. A K-map
contains the same information arranged in as many effective dimensions as there are independent
variables in the function. The special form of the representation provides a simple procedure for mini-
mizing the expression and, hence, the number of components required for realizing the function in a
given form. The function is represented in a space that in a Venn diagram is called the universal set. The
K-map is a special form of Venn diagram. The space is divided into two halves for each of the independent
variables. The division of the space into halves is different for each independent variable. For one inde-
pendent variable the space is divided into two different identical size regions, each of which represents
n
a minterm of the function. For n independent variables the space is divided into 2 different identical
n
size regions, one for each of the 2 minterms of the function. This and associated considerations are
illustrated in a sequence of figures from Figs. 36.8–36.15.
Figure 36.8 shows one-variable K-map formats. Figure 36.8(a) shows the space divided into two equal
areas, one for each of the two minterms possible for a single variable. The squares could also be identified
by the variable placed external to the space to designate the region that is the domain of the variable,
with the unlabeled space being the domain of the complement of the variable, as shown in Fig. 36.8(b).
Another way of identifying the regions is by means of the minterm number the area is for, as shown in
Fig. 36.8(c). Still another way is to place the values the variable can have as a scale alongside the space,
as shown in Fig. 36.8(d). The composite labeling, shown in Fig. 36.8(e), appears redundant but is often
useful because of the different modes of thought used with the different label types. Putting the actual
minterm expressions inside each square is too cluttering and is rarely used except as an aid in teaching
the theory of K-maps. The use of minterm numbers, although widely used, also clutters up the diagram,
and the methodology presented here makes their use superfluous once the concepts are understood.
©2002 CRC Press LLC