
Page 140 - Thermodynamics of Biochemical Reactions
P. 140
7.6 Effect of pH on Protein-Ligand Equilibria 137
. . . . . . . . . . . . --=-:-
---
-_
. -_
.
.
7
6 7 8 9 ' PH
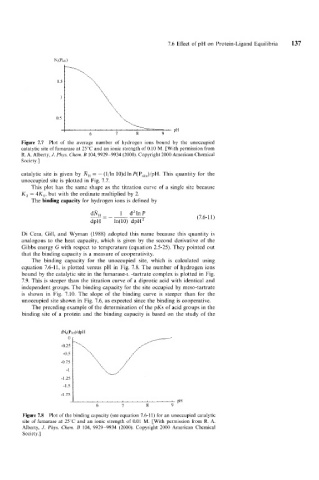
Figure 7.7 Plot of the average number of hydrogen ions bound by the unoccupied
catatytic site of fumarase at 25°C and an ionic strength of 0.10 M. [With permission from
R. A. Alberty, J. Phys. Chenz. B 104,9929-9934 (2000). Copyright 2000 American Chemical
Society.]
catalytic site is given by R, = - (l/ln 10)d In P(P,,,,)/pH. This quantity for the
unoccupied site is plotted in Fig. 7.7.
This plot has the same shape as the titration curve of a single site because
K, = 4K,, but with the ordinate multiplied by 2.
The binding capacity for hydrogen ions is defined by
dRH - 1 d21nP (7.6-1 1)
dpH ln(10) dpH2
Di Cera, Gill, and Wyman (1988) adopted this name because this quantity is
analogous to the heat capacity, which is given by the second derivative of the
Gibbs energy G with respect to temperature (equation 2.5-25). They pointed out
that the binding capacity is a measure of cooperativity.
The binding capacity for the unoccupied site, which is calculated using
equation 7.6-11, is plotted versus pH in Fig. 7.8. The number of hydrogen ions
bound by the catalytic site in the fumarase-r. -tartrate complex is plotted in Fig.
7.9. This is steeper than the titration curve of a diprotic acid with identical and
independent groups. The binding capacity for the site occupied by meso-tartrate
is shown in Fig. 7.10. The slope of the binding curve is steeper than for the
unoccupied site shown in Fig. 7.6, as expected since the binding is cooperative.
The preceding example of the determination of the pKs of acid groups in the
binding site of a protein and the binding capacity is based on the study of the
-1.25
-1.5
-1.75
6 7 8 9
Figure 7.8 Plot of the binding capacity (see equation 7.6-11) for an unoccupied catalytic
site of fumarase at 25°C and an ionic strength of 0.01 M. [With permission from R. A.
Alberty, J. Phys. Chem. B 104, 9929-9934 (2000). Copyright 2000 American Chemical
Society.]