
Page 288 - Bird R.B. Transport phenomena
P. 288
272 Chapter 9 Thermal Conductivity and the Mechanisms of Energy Transport
§9.2 TEMPERATURE AND PRESSURE DEPENDENCE OF
THERMAL CONDUCTIVITY
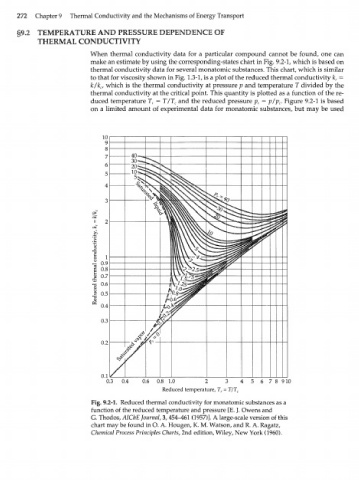
When thermal conductivity data for a particular compound cannot be found, one can
make an estimate by using the corresponding-states chart in Fig. 9.2-1, which is based on
thermal conductivity data for several monatomic substances. This chart, which is similar
to that for viscosity shown in Fig. 1.3-1, is a plot of the reduced thermal conductivity k =
r
k/k c/ which is the thermal conductivity at pressure p and temperature T divided by the
thermal conductivity at the critical point. This quantity is plotted as a function of the re-
duced temperature T = T/T and the reduced pressure p = p/p . Figure 9.2-1 is based
r c r c
on a limited amount of experimental data for monatomic substances, but may be used
1
о
i
1
0.1
0.4 0.6 0.8 1.0 2 3 4 5 6 7 8 910
Reduced temperature, T = T/T
r c
Fig. 9.2-1. Reduced thermal conductivity for monatomic substances as a
function of the reduced temperature and pressure [E. J. Owens and
G. Thodos, AIChE Journal, 3,454-461 (1957)]. A large-scale version of this
chart may be found in O. A. Hougen, K. M. Watson, and R. A. Ragatz,
Chemical Process Principles Charts, 2nd edition, Wiley, New York (1960).