
Page 289 - Bird R.B. Transport phenomena
P. 289
§9.2 Temperature and Pressure Dependence of Thermal Conductivity 273
for rough estimates for polyatomic materials. It should not be used in the neighborhood
of the critical point. 1
It can be seen that the thermal conductivity of a gas approaches a limiting function
of T at low pressures; for most gases this limit is reached at about 1 atm pressure. The
thermal conductivities of gases at low density increase with increasing temperature,
whereas the thermal conductivities of most liquids decrease with increasing temperature.
The correlation is less reliable in the liquid region; polar or associated liquids, such as
water, may exhibit a maximum in the curve of к versus T. The main virtue of the
corresponding-states chart is that one gets a global view of the behavior of the thermal
conductivity of gases and liquids.
The quantity k may be estimated in one of two ways: (i) given A: at a known temper-
c
ature and pressure, preferably close to the conditions at which к is to be estimated, one
can read k from the chart and compute k c = k/k ; r or (ii) one can estimate a value of к in
r
the low-density region by the methods given in §9.3 and the proceed as in (i). Values of
k obtained by method (i) are given in Appendix E.
c
For mixtures, one might estimate the thermal conductivity by methods analogous to
those described in §1.3. Very little is known about the accuracy of pseudocritical proce-
dures as applied to thermal conductivity, largely because there are so few data on mix-
tures at elevated pressures.
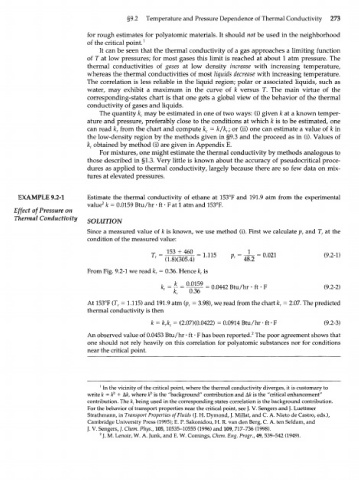
EXAMPLE 9.2-1 Estimate the thermal conductivity of ethane at 153°F and 191.9 atm from the experimental
2
value к = 0.0159 Btu/hr • ft • F at: 1 atm and 153°F.
Effect of Pressure on
Thermal Conductivity SOLUTION
Since a measured value of к is known, we use method (i). First we calculate p r and T at the
r
condition of the measured value:
From Fig. 9.2-1 we read k = 0.36. Hence k is
c
r
/ ' '
vr §W = a0442 Btu hr ft F
At 153°F (T = 1.115) and 191.9 atm (p = 3.98), we read from the chart k = 2.07. The predicted
r
r
r
thermal conductivity is then
к = k k c = (2.07X0.0422) = 0.0914 Btu/hr • ft • F (9.2-3)
r
2
An observed value of 0.0453 Btu/hr • ft • F has been reported. The poor agreement shows that
one should not rely heavily on this correlation for polyatomic substances nor for conditions
near the critical point.
1
In the vicinity of the critical point, where the thermal conductivity diverges, it is customary to
ъ
write к = к + &k, where к is the "background" contribution and A/c is the "critical enhancement"
ъ
contribution. The k being used in the corresponding states correlation is the background contribution.
c
For the behavior of transport properties near the critical point, see J. V. Sengers and J. Luettmer
Strathmann, in Transport Properties of Fluids (J. H. Dymond, J. Millat, and C. A. Nieto de Castro, eds.),
Cambridge University Press (1995); E. P. Sakonidou, H. R. van den Berg, С A. ten Seldam, and
J. V. Sengers, /. Chem. Phys., 105,10535-10555 (1996) and 109, 717-736 (1998).
2
J. M. Lenoir, W. A. Junk, and E. W. Comings, Chem. Eng. Progr., 49, 539-542 (1949).