
Page 305 - Trenchless Technology Piping Installation and Inspection
P. 305
Pr oject Considerations for Pipe Replacement Methods 269
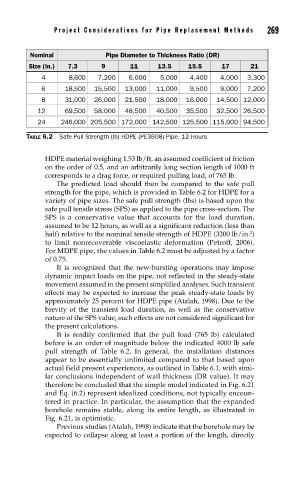
Nominal Pipe Diameter to Thickness Ratio (DR)
Size (in.) 7.3 9 11 13.5 15.5 17 21
4 8,600 7,200 6,000 5,000 4,400 4,000 3,300
6 18,500 15,500 13,000 11,000 9,500 9,000 7,200
8 31,000 26,000 21,500 18,000 16,000 14,500 12,000
12 69,500 58,000 48,500 40,500 35,500 32,500 26,500
24 246,000 205,500 172,000 142,500 125,500 115,000 94,500
TABLE 6.2 Safe Pull Strength (lb) HDPE (PE3608) Pipe, 12 Hours
HDPE material weighing 1.53 lb/ft, an assumed coefficient of friction
on the order of 0.5, and an arbitrarily long section length of 1000 ft
corresponds to a drag force, or required pulling load, of 765 lb.
The predicted load should then be compared to the safe pull
strength for the pipe, which is provided in Table 6.2 for HDPE for a
variety of pipe sizes. The safe pull strength (lbs) is based upon the
safe pull tensile stress (SPS) as applied to the pipe cross-section. The
SPS is a conservative value that accounts for the load duration,
assumed to be 12 hours, as well as a significant reduction (less than
half) relative to the nominal tensile strength of HDPE (3200 lb/in. )
2
to limit nonrecoverable viscoelastic deformation (Petroff, 2006).
For MDPE pipe, the values in Table 6.2 must be adjusted by a factor
of 0.75.
It is recognized that the new-bursting operations may impose
dynamic impact loads on the pipe, not reflected in the steady-state
movement assumed in the present simplified analyses. Such transient
effects may be expected to increase the peak steady-state loads by
approximately 25 percent for HDPE pipe (Atalah, 1998). Due to the
brevity of the transient load duration, as well as the conservative
nature of the SPS value, such effects are not considered significant for
the present calculations.
It is readily confirmed that the pull load (765 lb) calculated
before is an order of magnitude below the indicated 4000 lb safe
pull strength of Table 6.2. In general, the installation distances
appear to be essentially unlimited compared to that based upon
actual field present experiences, as outlined in Table 6.1, with simi-
lar conclusions independent of wall thickness (DR value). It may
therefore be concluded that the simple model indicated in Fig. 6.21
and Eq. (6.2) represent idealized conditions, not typically encoun-
tered in practice. In particular, the assumption that the expanded
borehole remains stable, along its entire length, as illustrated in
Fig. 6.21, is optimistic.
Previous studies (Atalah, 1998) indicate that the borehole may be
expected to collapse along at least a portion of the length, directly