
Page 106 - Tunable Lasers Handbook
P. 106
4 CO, Isotope Lasers and Their Applications 87
S/N = -1000 T = 0.1 we (ringla pole)
Af = -f 200 kHz Po = 1.m W; P(20); l0.6~
tm = 260 Hz p = 0.034 Torr
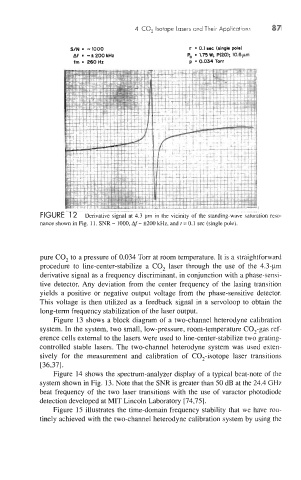
FIGURE 12 Derivative signal at 4.3 pm in the vicinity of the standing-wave saturation reso-
nance shown in Fig. 11. SNR - 1000, Af - f200 kHz, and t = 0.1 sec (single pole).
pure CO, to a pressure of 0.034 Torr at room temperature. It is a straightforward
procedure to line-center-stabilize a CO, laser through the use of the 4.3-pm
derivative signal as a frequency discriminant, in conjunction with a phase-sensi-
tive detector. Any deviation from the center frequency of the lasing transition
yields a positive or negative output voltage from the phase-sensitive detector.
This voltage is then utilized as a feedback signal in a servoloop to obtain the
long-term frequency stabilization of the laser output.
Figure 13 shows a block diagram of a two-channel heterodyne calibration
system. In the system, two small, low-pressure, room-temperature C0,-gas ref-
erence cells external to the lasers were used to line-center-stabilize two grating-
controlled stable lasers. The two-channel heterodyne system was used exten-
sively for the measurement and calibration of C0,-isotope laser transitions
[36,37].
Figure 14 shows the spectrum-analyzer display of a typical beat-note of the
system shown in Fig. 13. Note that the SNR is greater than 50 dB at the 24.4 GHz
beat frequency of the two laser transitions with the use of varactor photodiode
detection developed at MIT Lincoln Laboratory [74,75].
Figure 15 illustrates the time-domain frequency stability that we have rou-
tinely achieved with the two-channel heterodyne calibration system by using the