
Page 107 - Tunable Lasers Handbook
P. 107
88 Charles Freed
FIGURE 1 3 Block diagram of the two-channel line-center-stabilized C0,-isotope calibration
system. In the figure, wavy and solid lines denote optical and electrical paths, respectively. (Reprinted
with permission from Freed [75]. 0 1982 IEEE.)
-20
-30
m^ -40 52 dB
'D
0
9 -50
-60 7-- I
-70
-80
4 + 200kHz
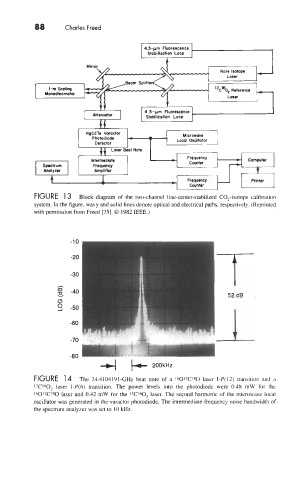
FIGURE 14 The 24.4104191-GHz beat note of a 16012CfSO laser I-P(l2) transition and a
l*C1602 laser I-P(6) transition. The power levels into the photodiode were 0.48 mW for the
16012C180 laser and 0.42 mW for the 12C160, laser. The second harmonic of the microwave local
oscillator was generated in the varactor photodiode. The intermediate-frequency noise bandwidth of
the spectrum analyzer was set to 10 kHz.