
Page 109 - Tunable Lasers Handbook
P. 109
90 Charles Freed
The triangular symbols in Fig. 15 represent the frequency stability of a
Hewlett-Packard (HP) model 5061B cesium atomic frequency standard, as spec-
ified in the HP catalog. Clearly, the frequency stabilities of the CO, and the
cesium-stabilized systems shown in Fig. 15 are about the same.
The two cross-circles in the lower left corner of Fig. 15 denote the upper
bound of the short-term frequency stabilities, as measured in the laboratory (Fig.
6) and determined from CO, radar returns at the Lincoln Laboratory Firepond
Facility [56,58]. Note that the CO, radar has achieved short-term stabilities of at
least two to three orders of magnitude better than those of microwave systems.
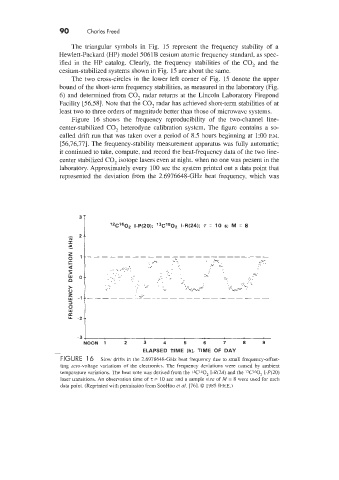
Figure 16 shows the frequency reproducibility of the two-channel line-
center-stabilized CO, heterodyne calibration system. The figure contains a so-
called drift run that was taken over a period of 8.5 hours beginning at 1:OO P.M.
[56,76,77]. The frequency-stability measurement apparatus was fully automatic;
it continued to take, compute, and record the beat-frequency data of the two line-
center stabilized CO, isotope lasers even at night. when no one was present in the
laboratory. Approxinlately every 100 sec the system printed out a data point that
represented the deviation from the 2.6976648-GHz beat frequency, which was
'2C'602 I-P(Z0); '3C'802 I-R(24); T = 10 s; M = 8
-2
E 31
-3 I
NOON 1 2 3 4 5 6 7 8 9
ELAPSED TIME (h), TIME OF DAY
FIGURE 16 Slow drifts in the 7.6978648-GHz beat frequency due to small frequency-offset-
ting zero-voltage variations of the electronics. The frequency deviations were caused by ambient
temperature variations. The beat note was derived from the 13C1800: I-R(24) and the 12C'602 I-P(Z0)
laser transitions. An obsemation time of 'I = 10 sec and a sample size of :21 = 8 were used for each
data point. (Reprinted with permission from SooHoo er nl. [76]. 0 1985 IEEE.)