
Page 118 - Tunable Lasers Handbook
P. 118
98 Charles Freed
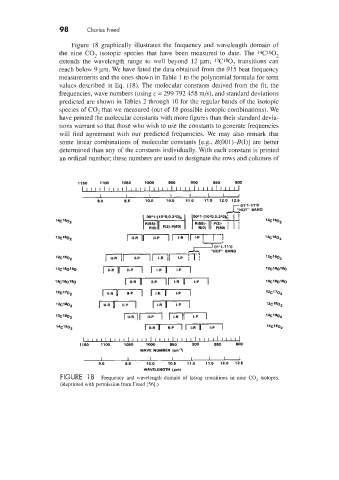
Figure 18 graphically illustrates the frequency and wavelength domain of
the nine CO? isotopic species that have been measured to date. The 14C160,
extends the wavelength range to well beyond 12 pm; 13C180, transitions can
reach below 9 ym. We have fitted the data obtained from the 915 beat frequency
measurements and the ones shown in Table 1 to the polynomial formula for term
values described in Eq. (1 8). The molecular constants derived from the fit. the
frequencies. wave numbers (using c = 299 792 458 m/s), and standard deviations
predicted are shown in Tables 2 through 10 for the regular bands of the isotopic
species of CO, that we measured (out of 18 possible isotopic combinations). We
have printed the molecular constants with more figures than their standard devia-
tions warrant so that those who wish to use the constants to generate frequencies
will find agreement with our predicted frequencies. We may also remark that
some linear combinations of molecular constants [e&. B(OOl)-B(I)] are better
determined than any of the constants individually. With each constant is printed
an ordinal number; these numbers are used to designate the rows and columns of
Il-R Il-P I-R I-P
Il-R Il-P I-R I-P
WAVE NUMBER (an-'l
I I I I I I I 1
9.0 9.6 10.0 10.5 11.0 11.5 12.0 12.5
WAVELENGTH (p)
FIGURE 1 8 Frequency and wavelength domain of lasing transitions in nine co, isotopes
(Reprinted with permission from Freed [56].)