
Page 159 - Tunable Lasers Handbook
P. 159
4 CO, Isotope lasers and Their Applications 139
kHz/Torr of the laser's gas mixture. Because the typical CO, fill pressures in the
saturable absorber cells used to line-center-stabilize the lasers in the two-channel
calibration system were about 40 mTorr, a first-order guess-estimate indicated an
approximately 1.2-kHz systematic error in the beat measurements. The magni-
tude of such an error was too small to worry about too much during the first few
years of calibrating the CO, laser transitions. When the uncertainties in the mea-
sured results diminished from about 20 to 25 kHz to about 5 kHz or less. it
seemed prudent to initiate a more precise theoretical and experimental endeavor
for evaluating the effect of pressure shift on the frequency calibration of CO, -
laser transitions. Thus "Pressure Shifts in Carbon Dioxide and Its Isotopes"
became the topic of the PhD dissertation of SooHoo who then proceeded to
compile a vast amount of experimental data and all available theoretical interpre-
tations that took years of assiduous work [112]. The in many ways surprising
outcome of this research was summarized in two publications by SooHoo et a/.
l ~ l ' l ~ l ' l
co, lLP(20)
1 63 kHz/Torr
4 1
BLUE SHIFT BLUE SHIFT/ /
!
L 1
I I ~ ~ I I ~ ~ I I ' ' I I ' ' I I
,t 'r\
la
13 la
13
co,
co, I-R(20) BLUE SHIFT >
I-R(20)
47
kHz/Torr
47 kHz/Torr
BLUE SHIFT 6l , , ,
8 8 , , , , , , , ,
0 20 40 60 80 100 0 20 40 60 80 100
PRESSURE (rn Torr)
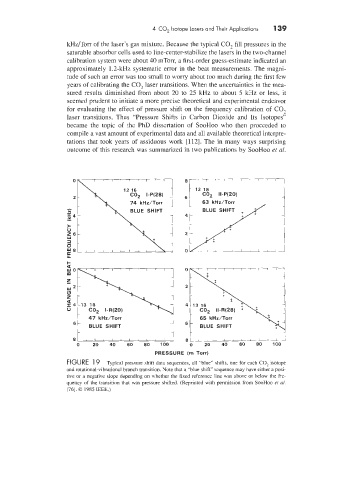
FIGURE 19 Typical pressure shift data sequences, all "blue" shifts, one for each C02 isotope
and rotational-vibrational branch transition. Note that a "blue shift" sequence may have either a posi-
tive or a negative slope depending on whether the fixed reference line was above or below the fre-
quency of the transition that was pressure shifted. (Reprinted with permission from SooHoo er al.
[76]. 0 1985 IEEE.)