
Page 360 - Tunable Lasers Handbook
P. 360
320 Norman P. Barnes
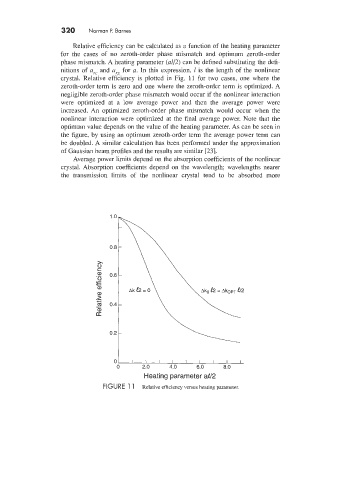
Relative efficiency can be calculated as a function of the heating parameter
for the cases of no zeroth-order phase mismatch and optimum zeroth-order
phase mismatch. A heating parameter (42) can be defined substituting the defi-
nitions of arc and urs for a. In this expression, 1 is the length of the nonlinear
crystal. Relative efficiency is plotted in Fig. 11 for two cases, one where the
zeroth-order term is zero and one where the zeroth-order term is optimized. A
negligible zeroth-order phase mismatch would occur if the nonlinear interaction
were optimized at a low average power and then the average power were
increased. An optimized zeroth-order phase mismatch would occur when the
nonlinear interaction were optimized at the final average power. Note that the
optimum value depends on the value of the heating parameter. As can be seen in
the figure, by using an optimum zeroth-order term the average power term can
be doubled. A similar calculation has been performed under the approximation
of Gaussian beam profiles and the results are similar [23].
Average power limits depend on the absorption coefficients of the nonlinear
crystal. Absorption coefficients depend on the wavelength; wavelengths nearer
the transmission limits of the nonlinear crystal tend to be absorbed more
1 .o
0.8
=-
0
c
- - 0.6
.a,
.-
0
Q,
Q,
>
.-
- 0.4
c
(d
Q,
U
0.2
0 I I I I I I I I I
2.0 4.0 6.0 8.0
Heating parameter aU2
FIGURE 1 1 Relative efficiency versus heating parameter.