Page 74 - Understanding Automotive Electronics
P. 74

2735 | CH 2  Page 61  Tuesday, March 10, 1998  10:55 AM


                                         THE SYSTEMS APPROACH TO CONTROL AND INSTRUMENTATION               2


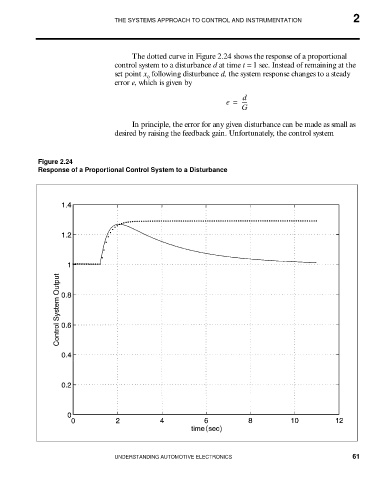
                                              The dotted curve in Figure 2.24 shows the response of a proportional
                                         control system to a disturbance d at time t = 1 sec. Instead of remaining at the
                                         set point x  following disturbance d, the system response changes to a steady
                                                  o
                                         error e, which is given by
                                                                            d
                                                                        e =  ----
                                                                            G

                                              In principle, the error for any given disturbance can be made as small as
                                         desired by raising the feedback gain. Unfortunately, the control system


                    Figure 2.24
                    Response of a Proportional Control System to a Disturbance


                                         UNDERSTANDING AUTOMOTIVE ELECTRONICS                             61
   69   70   71   72   73   74   75   76   77   78   79