
Page 201 - Uninterruptible Power Supplies
P. 201
Batteries
Batteries 199
100
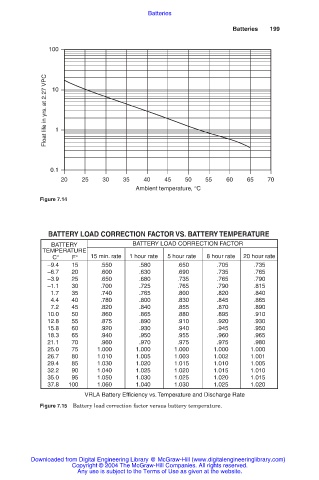
Float life in yrs. at 2.27 VPC 10 1
0.1
20 25 30 35 40 45 50 55 60 65 70
Ambient temperature, °C
Figure 7.14
BATTERY LOAD CORRECTION FACTOR VS. BATTERY TEMPERATURE
BATTERY BATTERY LOAD CORRECTION FACTOR
TEMPERATURE
C° F° 15 min. rate 1 hour rate 5 hour rate 8 hour rate 20 hour rate
–9.4 15 .550 .580 .650 .705 .735
–6.7 20 .600 .630 .690 .735 .765
–3.9 25 .650 .680 .735 .765 .790
–1.1 30 .700 .725 .765 .790 .815
1.7 35 .740 .765 .800 .820 .840
4.4 40 .780 .800 .830 .845 .865
7.2 45 .820 .840 .855 .870 .890
10.0 50 .860 .865 .880 .895 .910
12.8 55 .875 .890 .910 .920 .930
15.8 60 .920 .930 .940 .945 .950
18.3 65 .940 .950 .955 .960 .965
21.1 70 .960 .970 .975 .975 .980
25.0 75 1.000 1.000 1.000 1.000 1.000
26.7 80 1.010 1.005 1.003 1.002 1.001
29.4 85 1.030 1.020 1.015 1.010 1.005
32.2 90 1.040 1.025 1.020 1.015 1.010
35.0 95 1.050 1.030 1.025 1.020 1.015
37.8 100 1.060 1.040 1.030 1.025 1.020
VRLA Battery Efficiency vs. Temperature and Discharge Rate
Figure 7.15 Battery load correction factor versus battery temperature.
Downloaded from Digital Engineering Library @ McGraw-Hill (www.digitalengineeringlibrary.com)
Copyright © 2004 The McGraw-Hill Companies. All rights reserved.
Any use is subject to the Terms of Use as given at the website.