
Page 212 - Uninterruptible Power Supplies
P. 212
Batteries
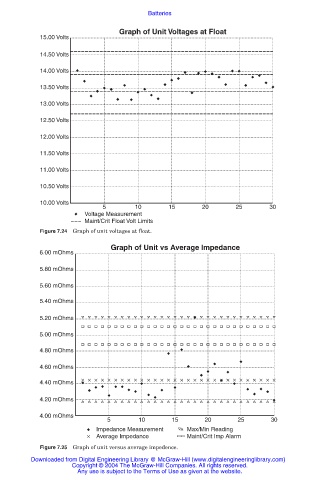
Graph of Unit Voltages at Float
15.00 Volts
14.50 Volts
14.00 Volts
13.50 Volts
13.00 Volts
12.50 Volts
12.00 Volts
11.50 Volts
11.00 Volts
10.50 Volts
10.00 Volts
5 10 15 20 25 30
Voltage Measurement
Maint/Crit Float Volt Limits
Figure 7.24 Graph of unit voltages at float.
Graph of Unit vs Average Impedance
6.00 mOhms
5.80 mOhms
5.60 mOhms
5.40 mOhms
5.20 mOhms
5.00 mOhms
4.80 mOhms
4.60 mOhms
4.40 mOhms
4.20 mOhms
4.00 mOhms
5 10 15 20 25 30
Impedance Measurement Max/Min Reading
Average Impedance Maint/Crit Imp Alarm
Figure 7.25 Graph of unit versus average impedence.
Downloaded from Digital Engineering Library @ McGraw-Hill (www.digitalengineeringlibrary.com)
Copyright © 2004 The McGraw-Hill Companies. All rights reserved.
Any use is subject to the Terms of Use as given at the website.