
Page 111 - Using ANSYS for Finite Element Analysis Dynamic, Probabilistic, Design and Heat Transfer Analysis
P. 111
98 • using ansys for finite eLement anaLysis
insight into the behavior of a component in a computer simulation if the
same (or almost the same) samples are repeated.
3.4.2 LATin hyPeRCUbe SAMPLing
The Latin Hypercube Sampling (LHS) technique is a more advanced and
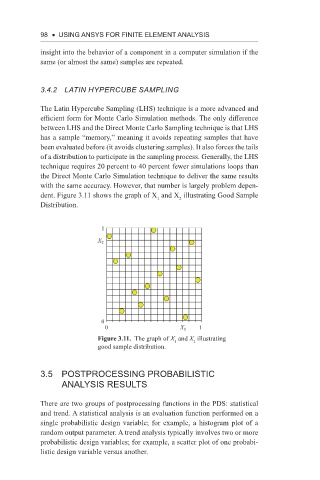
efficient form for Monte Carlo Simulation methods. The only difference
between LHS and the Direct Monte Carlo Sampling technique is that LHS
has a sample “memory,” meaning it avoids repeating samples that have
been evaluated before (it avoids clustering samples). It also forces the tails
of a distribution to participate in the sampling process. Generally, the LHS
technique requires 20 percent to 40 percent fewer simulations loops than
the Direct Monte Carlo Simulation technique to deliver the same results
with the same accuracy. However, that number is largely problem depen-
dent. Figure 3.11 shows the graph of X and X illustrating Good Sample
1
2
Distribution.
1
X 2
0
0 X 1 1
Figure 3.11. The graph of X and X illustrating
2
1
good sample distribution.
3.5 PostProCessing ProBaBiListiC
anaLysis resuLts
There are two groups of postprocessing functions in the PDS: statistical
and trend. A statistical analysis is an evaluation function performed on a
single probabilistic design variable; for example, a histogram plot of a
random output parameter. A trend analysis typically involves two or more
probabilistic design variables; for example, a scatter plot of one probabi-
listic design variable versus another.