
Page 113 - Using ANSYS for Finite Element Analysis Dynamic, Probabilistic, Design and Heat Transfer Analysis
P. 113
100 • using ansys for finite eLement anaLysis
3.5.1.3 Cumulative Distribution Function
The cdf is a primary review tool if you want to assess the reliability or the
failure probability of your component or product. Reliability is defined as
the probability that no failure occurs.
Hence, in a mathematical sense reliability and failure probability are
two sides of the same coin and numerically they complement each other
(are additive to 1.0). The cdf value at any given point expresses the prob-
ability that the respective parameter value will remain below that point.
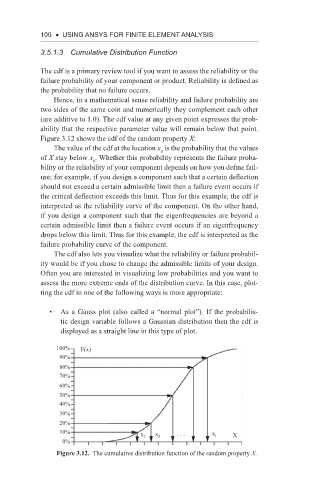
Figure 3.12 shows the cdf of the random property X:
The value of the cdf at the location x is the probability that the values
0
of X stay below x . Whether this probability represents the failure proba-
0
bility or the reliability of your component depends on how you define fail-
ure; for example, if you design a component such that a certain deflection
should not exceed a certain admissible limit then a failure event occurs if
the critical deflection exceeds this limit. Thus for this example, the cdf is
interpreted as the reliability curve of the component. On the other hand,
if you design a component such that the eigenfrequencies are beyond a
certain admissible limit then a failure event occurs if an eigenfrequency
drops below this limit. Thus for this example, the cdf is interpreted as the
failure probability curve of the component.
The cdf also lets you visualize what the reliability or failure probabil-
ity would be if you chose to change the admissible limits of your design.
Often you are interested in visualizing low probabilities and you want to
assess the more extreme ends of the distribution curve. In this case, plot-
ting the cdf in one of the following ways is more appropriate:
• As a Gauss plot (also called a “normal plot”). If the probabilis-
tic design variable follows a Gaussian distribution then the cdf is
displayed as a straight line in this type of plot.
100% F(x)
90%
80%
70%
60%
50%
40%
30%
20%
10% x 1 x 2 x i X
0%
Figure 3.12. The cumulative distribution function of the random property X.