
Page 376 -
P. 376
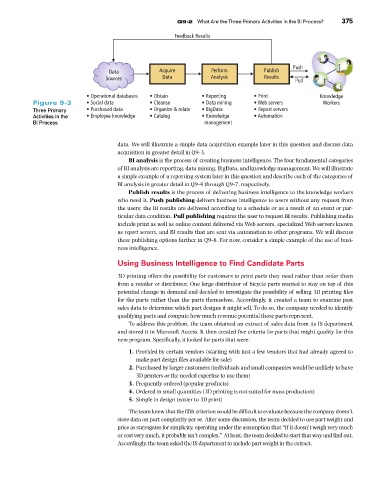
Q9-2  What Are the Three Primary Activities in the BI Process?

                                                                  Feedback Results                                      375


                                                                                                        Push
                                            Data             Acquire          Perform          Publish
                                           Sources            Data            Analysis         Results   Pull


                                     • Operational databases  • Obtain     • Reporting      • Print              Knowledge
                    Figure 9-3       • Social data        • Cleanse        • Data mining    • Web servers         Workers
                    Three Primary    • Purchased data     • Organize & relate  • BigData    • Report servers
                    Activities in the    • Employee knowledge  • Catalog   • Knowledge      • Automation
                    BI Process                                               management


                                               data. We will illustrate a simple data acquisition example later in this question and discuss data
                                               acquisition in greater detail in Q9-3.
                                                   BI analysis is the process of creating business intelligence. The four fundamental categories
                                               of BI analysis are reporting, data mining, BigData, and knowledge management. We will illustrate
                                               a simple example of a reporting system later in this question and describe each of the categories of
                                               BI analysis in greater detail in Q9-4 through Q9-7, respectively.
                                                   Publish results is the process of delivering business intelligence to the knowledge workers
                                               who need it. Push publishing delivers business intelligence to users without any request from
                                               the users; the BI results are delivered according to a schedule or as a result of an event or par-
                                               ticular data condition. Pull publishing requires the user to request BI results. Publishing media
                                               include print as well as online content delivered via Web servers, specialized Web servers known
                                               as report servers, and BI results that are sent via automation to other programs. We will discuss
                                               these publishing options further in Q9-8. For now, consider a simple example of the use of busi-
                                               ness intelligence.

                                               Using Business Intelligence to Find Candidate Parts

                                               3D printing offers the possibility for customers to print parts they need rather than order them
                                               from a retailer or distributor. One large distributor of bicycle parts wanted to stay on top of this
                                               potential change in demand and decided to investigate the possibility of selling 3D printing files
                                               for the parts rather than the parts themselves. Accordingly, it created a team to examine past
                                               sales data to determine which part designs it might sell. To do so, the company needed to identify
                                                 qualifying parts and compute how much revenue potential those parts represent.
                                                   To address this problem, the team obtained an extract of sales data from its IS department
                                               and stored it in Microsoft Access. It then created five criteria for parts that might quality for this
                                               new program. Specifically, it looked for parts that were:
                                                   1. Provided by certain vendors (starting with just a few vendors that had already agreed to
                                                     make part design files available for sale)
                                                   2.  Purchased by larger customers (individuals and small companies would be unlikely to have
                                                     3D printers or the needed expertise to use them)
                                                   3. Frequently ordered (popular products)
                                                   4. Ordered in small quantities (3D printing is not suited for mass production)
                                                   5. Simple in design (easier to 3D print)
                                                   The team knew that the fifth criterion would be difficult to evaluate because the company doesn’t
                                               store data on part complexity per se. After some discussion, the team decided to use part weight and
                                               price as surrogates for simplicity, operating under the assumption that “If it doesn’t weigh very much
                                               or cost very much, it probably isn’t complex.” At least, the team decided to start that way and find out.
                                               Accordingly, the team asked the IS department to include part weight in the extract.