
Page 378 -
P. 378
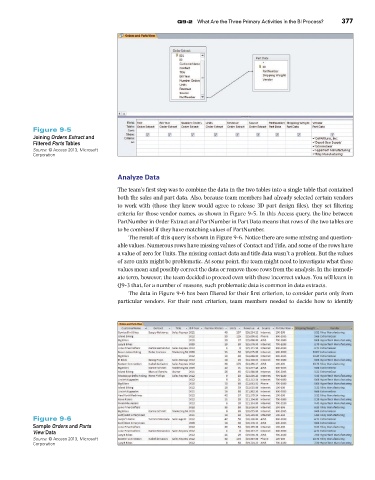
Figure 9-5                                     Q9-2  What Are the Three Primary Activities in the BI Process?    377
                    Joining Orders Extract and
                    Filtered Parts Tables
                    Source: © Access 2013, Microsoft
                    Corporation


                                               Analyze Data

                                               The team’s first step was to combine the data in the two tables into a single table that contained
                                               both the sales and part data. Also, because team members had already selected certain vendors
                                               to work with (those  they knew would agree  to release 3D  part design files),  they set filtering
                                               criteria for those vendor names, as shown in Figure 9-5. In this Access query, the line between
                                               PartNumber in Order Extract and PartNumber in Part Data means that rows of the two tables are
                                               to be combined if they have matching values of PartNumber.
                                                   The result of this query is shown in Figure 9-6. Notice there are some missing and question-
                                               able values. Numerous rows have missing values of Contact and Title, and some of the rows have
                                               a value of zero for Units. The missing contact data and title data wasn’t a problem. But the values
                                               of zero units might be problematic. At some point, the team might need to investigate what these
                                               values mean and possibly correct the data or remove those rows from the analysis. In the immedi-
                                               ate term, however, the team decided to proceed even with these incorrect values. You will learn in
                                               Q9-3 that, for a number of reasons, such problematic data is common in data extracts.
                                                   The data in Figure 9-6 has been filtered for their first criterion, to consider parts only from
                                               particular  vendors.  For  their  next  criterion,  team  members  needed  to  decide  how  to  identify


                    Figure 9-6
                    Sample Orders and Parts
                    View Data
                    Source: © Access 2013, Microsoft
                    Corporation