
Page 380 -
P. 380
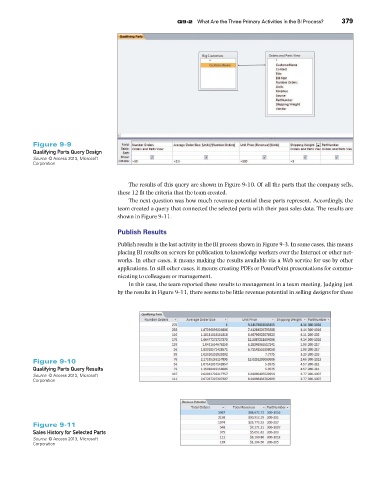
Figure 9-9                                     Q9-2  What Are the Three Primary Activities in the BI Process?    379
                    Qualifying Parts Query Design
                    Source: © Access 2013, Microsoft
                    Corporation


                                                   The results of this query are shown in Figure 9-10. Of all the parts that the company sells,
                                               these 12 fit the criteria that the team created.
                                                   The next question was how much revenue potential these parts represent. Accordingly, the
                                               team created a query that connected the selected parts with their past sales data. The results are
                                               shown in Figure 9-11.


                                               Publish Results
                                               Publish results is the last activity in the BI process shown in Figure 9-3. In some cases, this means
                                               placing BI results on servers for publication to knowledge workers over the Internet or other net-
                                               works. In other cases, it means making the results available via a Web service for use by other
                                               applications. In still other cases, it means creating PDFs or PowerPoint presentations for commu-
                                               nicating to colleagues or management.
                                                   In this case, the team reported these results to management in a team meeting. Judging just
                                               by the results in Figure 9-11, there seems to be little revenue potential in selling designs for these


                    Figure 9-10
                    Qualifying Parts Query Results
                    Source: © Access 2013, Microsoft
                    Corporation


                    Figure 9-11
                    Sales History for Selected Parts
                    Source: © Access 2013, Microsoft
                    Corporation