
Page 383 -
P. 383
Chapter 9 Business Intelligence Systems
382
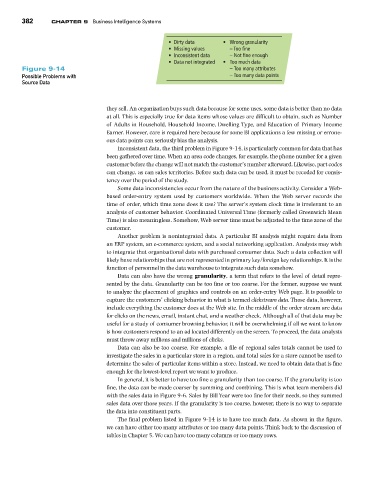
• Dirty data • Wrong granularity
• Missing values – Too fine
• Inconsistent data – Not fine enough
• Data not integrated • Too much data
Figure 9-14 – Too many attributes
Possible Problems with – Too many data points
Source Data
they sell. An organization buys such data because for some uses, some data is better than no data
at all. This is especially true for data items whose values are difficult to obtain, such as Number
of Adults in Household, Household Income, Dwelling Type, and Education of Primary Income
Earner. However, care is required here because for some BI applications a few missing or errone-
ous data points can seriously bias the analysis.
Inconsistent data, the third problem in Figure 9-14, is particularly common for data that has
been gathered over time. When an area code changes, for example, the phone number for a given
customer before the change will not match the customer’s number afterward. Likewise, part codes
can change, as can sales territories. Before such data can be used, it must be recoded for consis-
tency over the period of the study.
Some data inconsistencies occur from the nature of the business activity. Consider a Web-
based order-entry system used by customers worldwide. When the Web server records the
time of order, which time zone does it use? The server’s system clock time is irrelevant to an
analysis of customer behavior. Coordinated Universal Time (formerly called Greenwich Mean
Time) is also meaningless. Somehow, Web server time must be adjusted to the time zone of the
customer.
Another problem is nonintegrated data. A particular BI analysis might require data from
an ERP system, an e-commerce system, and a social networking application. Analysts may wish
to integrate that organizational data with purchased consumer data. Such a data collection will
likely have relationships that are not represented in primary key/foreign key relationships. It is the
function of personnel in the data warehouse to integrate such data somehow.
Data can also have the wrong granularity, a term that refers to the level of detail repre-
sented by the data. Granularity can be too fine or too coarse. For the former, suppose we want
to analyze the placement of graphics and controls on an order-entry Web page. It is possible to
capture the customers’ clicking behavior in what is termed clickstream data. Those data, however,
include everything the customer does at the Web site. In the middle of the order stream are data
for clicks on the news, email, instant chat, and a weather check. Although all of that data may be
useful for a study of consumer browsing behavior, it will be overwhelming if all we want to know
is how customers respond to an ad located differently on the screen. To proceed, the data analysts
must throw away millions and millions of clicks.
Data can also be too coarse. For example, a file of regional sales totals cannot be used to
investigate the sales in a particular store in a region, and total sales for a store cannot be used to
determine the sales of particular items within a store. Instead, we need to obtain data that is fine
enough for the lowest-level report we want to produce.
In general, it is better to have too fine a granularity than too coarse. If the granularity is too
fine, the data can be made coarser by summing and combining. This is what team members did
with the sales data in Figure 9-6. Sales by Bill Year were too fine for their needs, so they summed
sales data over those years. If the granularity is too coarse, however, there is no way to separate
the data into constituent parts.
The final problem listed in Figure 9-14 is to have too much data. As shown in the figure,
we can have either too many attributes or too many data points. Think back to the discussion of
tables in Chapter 5. We can have too many columns or too many rows.