
Page 388 -
P. 388
Q9-4 How Do Organizations Use Reporting Applications?
Customer RFM Score 387
Big 7 Sports 113
St. Louis Soccer Club 511
Miami Municipal 545
Figure 9-16 Central Colorado State 333
Example RFM Scores
Finally, the tool sorts the customers again according to the amount spent on their orders.
The 20 percent who have ordered the most expensive items are given an M score of 1, the next 20
percent are given an M score of 2, and so forth, down to the 20 percent who spend the least, who
are given an M score of 5.
Figure 9-16 shows sample RFM results. The first customer, Big 7 Sports, has ordered recently
and orders frequently. Big 7 Sports’ M score of 3 indicates, however, that it does not order the
most expensive goods. From these scores, the sales team can conclude that Big 7 Sports is a good,
regular customer and that it should attempt to up-sell more expensive goods to Big 7 Sports.
The second customer in Figure 9-16 could represent a problem. St. Louis Soccer Club has
not ordered in some time, but when it did order in the past, it ordered frequently, and its orders
were of the highest monetary value. This data suggests that St. Louis Soccer Club might have
taken its business to another vendor. Someone from the sales team should contact this customer
immediately.
No one on the sales team should even think about the third customer, Miami Municipal.
This company has not ordered for some time; it did not order frequently; and, when it did order, it
bought the least expensive items and not many of them. Let Miami Municipal go to the competi-
tion; the loss will be minimal.
The last customer, Central Colorado State, is right in the middle. Central Colorado State is an
OK customer, but probably no one in sales should spend much time with it. Perhaps sales can set
up an automated contact system or use the Central Colorado State account as a training exercise
for an eager departmental assistant or intern.
Online Analytical Processing (OLAP)
Online analytical processing (OLAP), a second type of reporting application, is more generic
than RFM. OLAP provides the ability to sum, count, average, and perform other simple arith-
metic operations on groups of data. The defining characteristic of OLAP reports is that they are
dynamic. The viewer of the report can change the report’s format, hence the term online.
An OLAP report has measures and dimensions. A measure is the data item of interest. It is the
item that is to be summed or averaged or otherwise processed in the OLAP report. Total sales, aver-
age sales, and average cost are examples of measures. A dimension is a characteristic of a measure.
Purchase date, customer type, customer location, and sales region are all examples of dimensions.
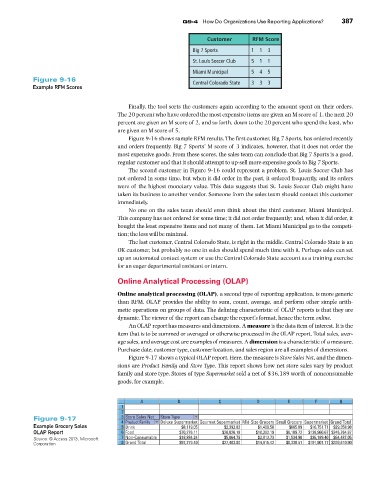
Figure 9-17 shows a typical OLAP report. Here, the measure is Store Sales Net, and the dimen-
sions are Product Family and Store Type. This report shows how net store sales vary by product
family and store type. Stores of type Supermarket sold a net of $36,189 worth of nonconsumable
goods, for example.
A B C D E F G
1
2
Figure 9-17 3 4 Store Sales Net Store Type
Deluxe Supermarket Gourmet Supermarket Mid-Size Grocery Small Grocery Supermarket Grand Total
Example Grocery Sales 5 Product Family $8,119.05 $2,392.83 $1,409.50 $685.89 $16,751.71 $29,358.98
Drink
OLAP Report 6 Food $70,276.11 $20,026.18 $10,392.19 $6,109.72 $138,960.67 $245,764.87
Source: © Access 2013, Microsoft 7 Non-Consumable $18,884.24 $5,064.79 $2,813.73 $1,534.90 $36,189.40 $64,487.05
Corporation 8 Grand Total $97,279.40 $27,483.80 $14,615.42 $8,330.51 $191,901.77 $339,610.90