
Page 390 -
P. 390
Grand Total $114,954.83 $158,468.91 $339,610.90 $339,610.90
J $2,392.83 $20,026.18 $5,064.79 $27,483.80 $2,870.33 $23,598.28 $6,305.14 $32,773.74 $3,050.43 $23,627.83 $6,039.34 $32,717.61 $227.38 $1,960.53 $474.35 $2,662.26 $95,637.41 $7,300.94 $61,597.22 $16,606.41 $85,504.57 $13,517.07 $29,997.01
Supermarket
I $2,870.33 $23,598.28 $6,305.14 $32,773.74 $3,050.43 $23,627.83 $6,039.34 $32,717.61 $65,491.35 $2,862.45 $23,818.87 $6,428.53 $33,109.85 $7,968.50 $67,915.69 $17,416.38 $93,300.57 $191,901.77 $191,901.77
H Small Grocery $227.38 $1,960.53 $474.35 $2,662.26 $2,662.26 $458.51 $4,149.19 $1,060.54 $5,668.24 $8,330.51 $8,330.51
Mid-Size Groce
G $1,409.50 $10,392.19 $2,813.73 $14,615.42 $14,615.42 $14,615.42
Gourmet Supermar
F $2,392.83 $20,026.18 $5,064.79 $27,483.80 $27,483.80 $27,483.80 $27,483.80
Store Type
E Deluxe Super $4,438.49 $37,778.35 $10,177.89 $52,394.72 $3,680.56 $32,497.76 $8,706.36 $44,884.68 $97,279.40 $97,279.40
Product Family Drink Food Drink Food Drink Food Drink Food Drink Food Drink Food
D Non-Consumable Non-Consumable Non-Consumable Non-Consumable Non-Consumable Non-Consumable
Store City San Diego
C Beverly Hills Beverly Hills Total Los Angeles Los Angeles Total San Diego Total San Francisco San Francisco Total
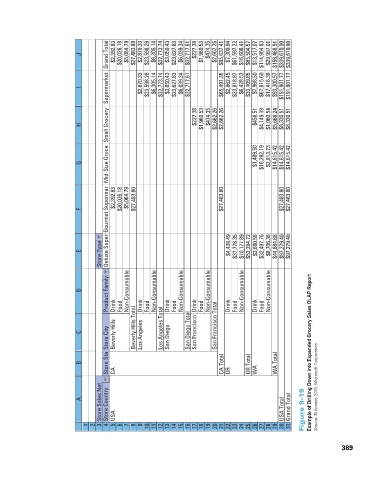
B Store Sta CA CA Total OR OR Total WA WA Total Example of Drilling Down into Expanded Grocery Sales OLAP Report
Store Sales Net Store Country USA Total Grand Total Figure 9-19
A Source: © Access 2013, Microsoft Corporation
10 11 12 13 14 15 16 17 18 19 20 21 22 23 24 25 26 27 28 29 30 31
1 2 3 4 USA 5 6 7 8 9
389