
Page 389 -
P. 389
Chapter 9 Business Intelligence Systems
388
A presentation like that in Figure 9-17 is often called an OLAP cube, or sometimes simply a
cube. The reason for this term is that some software products show these displays using three axes,
like a cube in geometry. The origin of the term is unimportant here, however. Just know that an
OLAP cube and an OLAP report are the same thing.
The OLAP report in Figure 9-17 was generated by Microsoft SQL Server Analysis Services
and is displayed in an Excel pivot table. The data was taken from a sample instructional database,
called Food Mart, that is provided with SQL Server.
It is possible to display OLAP cubes in many ways besides with Excel. Some third-party ven-
dors provide more extensive graphical displays. For more information about such products, check
for OLAP vendors and products at the Data Warehousing Review at http://dwreview.com/OLAP/
index.html. For an example of a superb, easy-to-use OLAP tool, visit www.TableauSoftware.com.
Tableau has a liberal student-use policy as well.
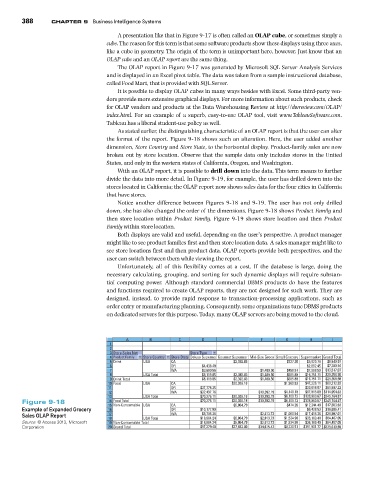
As stated earlier, the distinguishing characteristic of an OLAP report is that the user can alter
the format of the report. Figure 9-18 shows such an alteration. Here, the user added another
dimension, Store Country and Store State, to the horizontal display. Product-family sales are now
broken out by store location. Observe that the sample data only includes stores in the United
States, and only in the western states of California, Oregon, and Washington.
With an OLAP report, it is possible to drill down into the data. This term means to further
divide the data into more detail. In Figure 9-19, for example, the user has drilled down into the
stores located in California; the OLAP report now shows sales data for the four cities in California
that have stores.
Notice another difference between Figures 9-18 and 9-19. The user has not only drilled
down, she has also changed the order of the dimensions. Figure 9-18 shows Product Family and
then store location within Product Family. Figure 9-19 shows store location and then Product
Family within store location.
Both displays are valid and useful, depending on the user’s perspective. A product manager
might like to see product families first and then store location data. A sales manager might like to
see store locations first and then product data. OLAP reports provide both perspectives, and the
user can switch between them while viewing the report.
Unfortunately, all of this flexibility comes at a cost. If the database is large, doing the
necessary calculating, grouping, and sorting for such dynamic displays will require substan-
tial computing power. Although standard commercial DBMS products do have the features
and functions required to create OLAP reports, they are not designed for such work. They are
designed, instead, to provide rapid response to transaction-processing applications, such as
order entry or manufacturing planning. Consequently, some organizations tune DBMS products
on dedicated servers for this purpose. Today, many OLAP servers are being moved to the cloud.
A B C D E F G H I
1
2
3 Store Sales Net Store Type
4 Product Family Store Country Store State Deluxe Superma Gourmet Supermar Mid-Size Groce Small Grocery Supermarket Grand Total
5 Drink USA CA $2,392.83 $227.38 $5,920.76 $8,540.97
6 OR $4,438.49 $2,862.45 $7,300.94
7 WA $3,680.56 $1,409.50 $458.51 $7,968.50 $13,517.07
8 USA Total $8,119.05 $2,392.83 $1,409.50 $685.89 $16,751.71 $29,358.98
9 Drink Total $8,119.05 $2,392.83 $1,409.50 $685.89 $16,751.71 $29,358.98
10 Food USA CA $20,026.18 $1,960.53 $47,226.11 $69,212.82
11 OR $37,778.35 $23,818.87 $61,597.22
12 WA $32,497.76 $10,392.19 $4,149.19 $67,915.69 $114,954.83
13 USA Total $70,276.11 $20,026.18 $10,392.19 $6,109.72 $138,960.67 $245,764.87
Figure 9-18 14 Food Total CA $70,276.11 $20,026.18 $10,392.19 $6,109.72 $138,960.67 $245,764.87
$474.35
$5,064.79
$12,344.49
$17,883.63
Non-Consumable USA
15
Example of Expanded Grocery 16 OR $10,177.89 $6,428.53 $16,606.41
$8,706.36
Sales OLAP Report 17 USA Total WA $18,884.24 $5,064.79 $2,813.73 $1,060.54 $17,416.38 $29,997.01
$64,487.05
$36,189.40
18
$2,813.73
$1,534.90
Source: © Access 2013, Microsoft 19 Non-Consumable Total $18,884.24 $5,064.79 $2,813.73 $1,534.90 $36,189.40 $64,487.05
Corporation 20 Grand Total $97,279.40 $27,483.80 $14,615.42 $8,330.51 $191,901.77 $339,610.90