Page 379 -
P. 379
Chapter 9  Business Intelligence Systems
                378


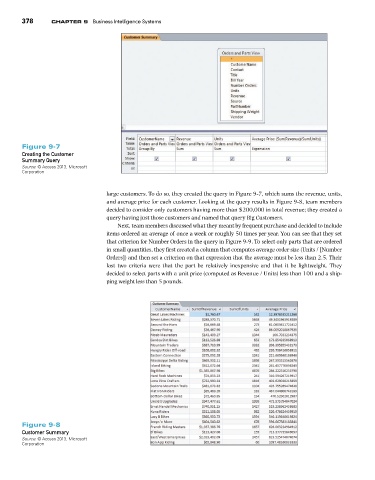
                Figure 9-7
                Creating the Customer
                Summary Query
                Source: © Access 2013, Microsoft
                Corporation


                                            large customers. To do so, they created the query in Figure 9-7, which sums the revenue, units,
                                            and average price for each customer. Looking at the query results in Figure 9-8, team members
                                            decided to consider only customers having more than $200,000 in total revenue; they created a
                                            query having just those customers and named that query Big Customers.
                                               Next, team members discussed what they meant by frequent purchase and decided to include
                                            items ordered an average of once a week or roughly 50 times per year. You can see that they set
                                            that criterion for Number Orders in the query in Figure 9-9. To select only parts that are ordered
                                            in small quantities, they first created a column that computes average order size (Units / [Number
                                            Orders]) and then set a criterion on that expression that the average must be less than 2.5. Their
                                            last two  criteria  were that the part  be  relatively  inexpensive  and that  it  be  lightweight.  They
                                            decided to select parts with a unit price (computed as Revenue / Units) less than 100 and a ship-
                                            ping weight less than 5 pounds.


                Figure 9-8
                Customer Summary
                Source: © Access 2013, Microsoft
                Corporation

