
Page 221 - Vibrational Spectroscopic Imaging for Biomedical Applications
P. 221
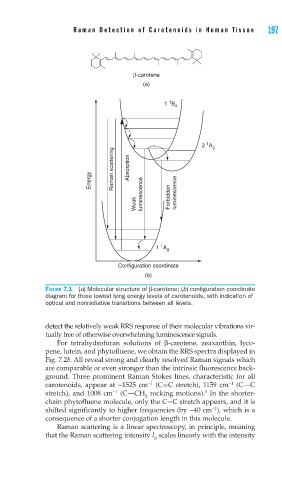
Raman Detection of Car otenoids in Human T issue   197


                                 β-carotene
                                   (a)


                                          1
                                         1 B u


                                                     1
                                                   2 A g
                           Raman scattering  Absorption

                     Energy


                                 Weak  luminescence  Forbidden  luminescence


                                        1
                                       1 A g

                            Configuration coordinate
                                    (b)

        FIGURE 7.1  (a) Molecular structure of β-carotene; (b) confi guration coordinate
        diagram for three lowest lying energy levels of carotenoids, with indication of
        optical and nonradiative transitions between all levels.


        detect the relatively weak RRS response of their molecular vibrations vir-
        tually free of otherwise overwhelming luminescence signals.
            For tetrahydrofuran solutions of  β-carotene, zeaxanthin, lyco-
        pene, lutein, and phytofluene, we obtain the RRS spectra displayed in
        Fig. 7.2b. All reveal strong and clearly resolved Raman signals which
        are comparable or even stronger than the intrinsic fluorescence back-
        ground. Three prominent Raman Stokes lines, characteristic for all
                                                           −1
                                     −1
        carotenoids, appear at ~1525 cm  (C=C stretch), 1159 cm  (C—C
                           −1
                                                    1
        stretch), and 1008 cm  (C—CH  rocking motions).  In the shorter-
                                    3
        chain phytofluene molecule, only the C=C stretch appears, and it is
                                                      −1
        shifted significantly to higher frequencies (by ~40 cm ), which is a
        consequence of a shorter conjugation length in this molecule.
            Raman scattering is a linear spectroscopy, in principle, meaning
        that the Raman scattering intensity I  scales linearly with the intensity
                                      S