
Page 222 - Vibrational Spectroscopic Imaging for Biomedical Applications
P. 222
198 Cha pte r Se v e n
0.6
Absorbance 0.4
0.2
0.0
350 400 450 500 1000
Wavelength, nm
(a)
β-carotene
Raman signal, counts Zeaxanthin
Lycopene
Lutein
Phytofluene
1000 1200 1400 1600 1800
Raman shift, cm –1
(b)
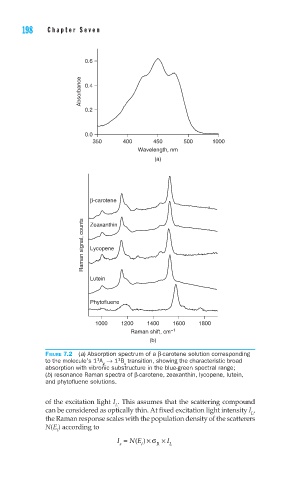
FIGURE 7.2 (a) Absorption spectrum of a β-carotene solution corresponding
1
1
to the molecule’s 1 A → 1 B transition, showing the characteristic broad
g u
absorption with vibronic substructure in the blue-green spectral range;
(b) resonance Raman spectra of β-carotene, zeaxanthin, lycopene, lutein,
and phytofl uene solutions.
of the excitation light I . This assumes that the scattering compound
L
can be considered as optically thin. At fixed excitation light intensity I ,
L
the Raman response scales with the population density of the scatterers
N(E ) according to
i
I = N E ×() σ × I
s i R L