
Page 225 - Vibrational Spectroscopic Imaging for Biomedical Applications
P. 225
Raman Detection of Car otenoids in Human T issue 201
Excitation light
ILM
NFL
HPN
PhR
RPE
Lipofuscin Raman Macular
emission scattering pigment
~ 1 mm
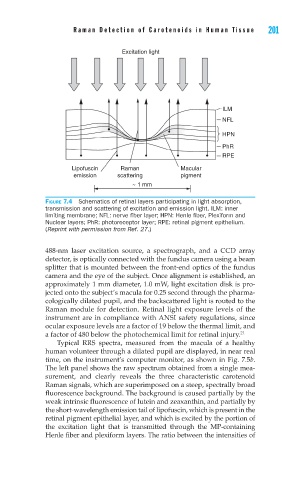
FIGURE 7.4 Schematics of retinal layers participating in light absorption,
transmission and scattering of excitation and emission light. ILM: inner
limiting membrane; NFL: nerve fi ber layer; HPN: Henle fi ber, Plexiform and
Nuclear layers; PhR: photoreceptor layer; RPE: retinal pigment epithelium.
(Reprint with permission from Ref. 27.)
488-nm laser excitation source, a spectrograph, and a CCD array
detector, is optically connected with the fundus camera using a beam
splitter that is mounted between the front-end optics of the fundus
camera and the eye of the subject. Once alignment is established, an
approximately 1 mm diameter, 1.0 mW, light excitation disk is pro-
jected onto the subject’s macula for 0.25 second through the pharma-
cologically dilated pupil, and the backscattered light is routed to the
Raman module for detection. Retinal light exposure levels of the
instrument are in compliance with ANSI safety regulations, since
ocular exposure levels are a factor of 19 below the thermal limit, and
a factor of 480 below the photochemical limit for retinal injury. 21
Typical RRS spectra, measured from the macula of a healthy
human volunteer through a dilated pupil are displayed, in near real
time, on the instrument’s computer monitor, as shown in Fig. 7.5b.
The left panel shows the raw spectrum obtained from a single mea-
surement, and clearly reveals the three characteristic carotenoid
Raman signals, which are superimposed on a steep, spectrally broad
fluorescence background. The background is caused partially by the
weak intrinsic fluorescence of lutein and zeaxanthin, and partially by
the short-wavelength emission tail of lipofuscin, which is present in the
retinal pigment epithelial layer, and which is excited by the portion of
the excitation light that is transmitted through the MP-containing
Henle fiber and plexiform layers. The ratio between the intensities of