
Page 229 - Vibrational Spectroscopic Imaging for Biomedical Applications
P. 229
Raman Detection of Car otenoids in Human T issue 205
7.4 Spatially Resolved Resonance Raman Imaging of
Macular Pigment—Methodology and Validation
Experiments
MP distributions are often assumed to have strict rotational symme-
try, with high-central pigment levels and a monotonous decline with
increasing eccentricity toward the peripheral retina. In order to gain
more insight into spatial distribution aspects of MP, we developed
24
resonance Raman imaging (RRI) of carotenoids. The experimental
setup for this purpose is shown in Fig. 7.7. Blue light from a solid-
state 488-nm laser is routed onto a subject’s retina via optical fiber,
CCD Camera
L3
F3
F5
F2
F4
BS2
Aiming Excitation laser
beam
CL F1
Fiber
BS1
Shutter
L1
AP L2
F4
F1
BS
Living eye AP
L2 L1
L3
Excised eye
(a) (b)
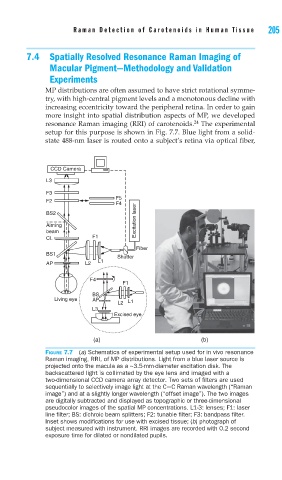
FIGURE 7.7 (a) Schematics of experimental setup used for in vivo resonance
Raman imaging, RRI, of MP distributions. Light from a blue laser source is
projected onto the macula as a ~3.5-mm-diameter excitation disk. The
backscattered light is collimated by the eye lens and imaged with a
two-dimensional CCD camera array detector. Two sets of fi lters are used
sequentially to selectively image light at the C=C Raman wavelength (“Raman
image”) and at a slightly longer wavelength (“offset image”). The two images
are digitally subtracted and displayed as topographic or three-dimensional
pseudocolor images of the spatial MP concentrations. L1-3: lenses; F1: laser
line fi lter; BS: dichroic beam splitters; F2: tunable fi lter; F3: bandpass fi lter.
Inset shows modifi cations for use with excised tissue; (b) photograph of
subject measured with instrument. RRI images are recorded with 0.2 second
exposure time for dilated or nondilated pupils.