
Page 234 - Vibrational Spectroscopic Imaging for Biomedical Applications
P. 234
210 Cha pte r Se v e n
significant lutein supplementation premortem. The eyes were placed
on a glass holder, the anterior segment was carefully cut away, and
the posterior segments with the macula were left in situ for RRI imag-
ing. At the conclusion of the imaging experiments, the macula was
punched out with a 5-mm diameter trephine, and macular carot-
enoids were extracted and analyzed by well-known HPLC methods.
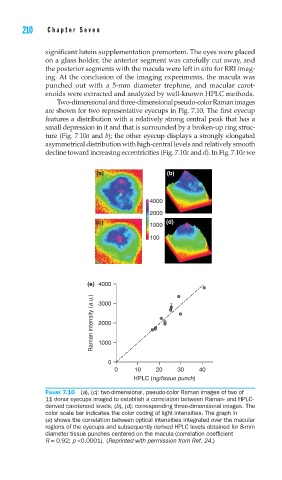
Two-dimensional and three-dimensional pseudo-color Raman images
are shown for two representative eyecups in Fig. 7.10. The first eyecup
features a distribution with a relatively strong central peak that has a
small depression in it and that is surrounded by a broken-up ring struc-
ture (Fig. 7.10a and b); the other eyecup displays a strongly elongated
asymmetrical distribution with high-central levels and relatively smooth
decline toward increasing eccentricities (Fig. 7.10c and d). In Fig. 7.10e we
(a) (b)
4000
2000
(c) (d)
1000
100
(e) 4000
Raman intensity (a.u.) 2000
3000
1000
0
0 10 20 30 40
HPLC (ng/tissue punch)
FIGURE 7.10 (a), (c): two-dimensional, pseudo-color Raman images of two of
11 donor eyecups imaged to establish a correlation between Raman- and HPLC-
derived carotenoid levels; (b), (d): corresponding three-dimensional images. The
color scale bar indicates the color coding of light intensities. The graph in
(e) shows the correlation between optical intensities integrated over the macular
regions of the eyecups and subsequently derived HPLC levels obtained for 8-mm
diameter tissue punches centered on the macula (correlation coeffi cient
R = 0.92; p <0.0001). (Reprinted with permission from Ref. 24.)