
Page 238 - Vibrational Spectroscopic Imaging for Biomedical Applications
P. 238
214 Cha pte r Se v e n
a category displaying relatively wide spatial distributions with a high-
central level, a second one again with high-central levels but narrower
spatial extent, a category with a ring-like MP distribution surround-
ing a central MP peak, and a category with relatively wide but overall
low levels. Intensities in the four distributions are all color coded with
the same intensity bar. Also, the spatial dimensions are identical. The
line plots shown in Fig. 7.12b correspond to the images in Fig. 7.12a.
They run along primary meridians and highlight the significant inter-
subject variations in MP levels, symmetries, and spatial extent.
(a) (b)
1.6 × 10 6
Integrated raman intensity 1.2 × 10 6 5
8.0 × 10
5
4.0 × 10
R = 0.89
P < 0.0001
0.0
0 200 400 600
Integrated O.D via fluorescence imaging
(c)
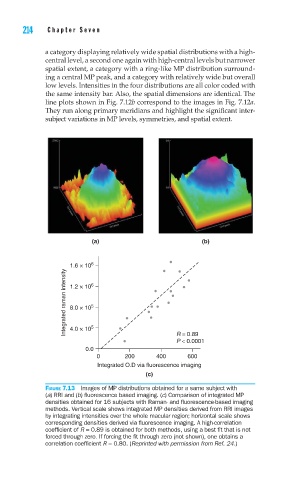
FIGURE 7.13 Images of MP distributions obtained for a same subject with
(a) RRI and (b) fl uorescence based imaging. (c) Comparison of integrated MP
densities obtained for 16 subjects with Raman- and fl uorescence-based imaging
methods. Vertical scale shows integrated MP densities derived from RRI images
by integrating intensities over the whole macular region; horizontal scale shows
corresponding densities derived via fl uorescence imaging. A high-correlation
coeffi cient of R = 0.89 is obtained for both methods, using a best fi t that is not
forced through zero. If forcing the fi t through zero (not shown), one obtains a
correlation coeffi cient R = 0.80. (Reprinted with permission from Ref. 24.)