
Page 237 - Vibrational Spectroscopic Imaging for Biomedical Applications
P. 237
Raman Detection of Car otenoids in Human T issue 213
3000
2000
1000
0
2000
4000 1500
Raman intensity 2000 Raman intensity 1000
3000
500
1000
0
0
–600 –300 0 300 600
–600 –300 0 300 600
Distance from fovea (μm)
Distance from fovea (μm)
1000
Raman intensity 400 Raman intensity 600
800
300
200
400
100
0 200 0
–600 –300 0 300 600 –900–600–300 0 300 600 900
Distance from fovea (μm) Distance from fovea (μm)
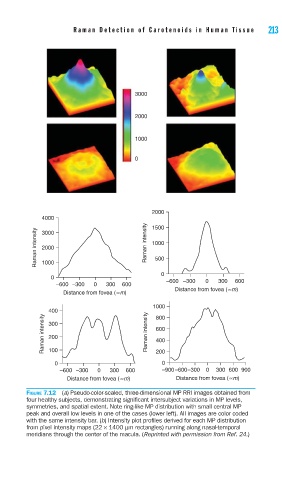
FIGURE 7.12 (a) Pseudo-color-scaled, three-dimensional MP RRI images obtained from
four healthy subjects, demonstrating signifi cant intersubject variations in MP levels,
symmetries, and spatial extent. Note ring-like MP distribution with small central MP
peak and overall low levels in one of the cases (lower left). All images are color coded
with the same intensity bar. (b) Intensity plot profi les derived for each MP distribution
from pixel intensity maps (22 × 1400 μm rectangles) running along nasal-temporal
meridians through the center of the macula. (Reprinted with permission from Ref. 24.)