
Page 233 - Vibrational Spectroscopic Imaging for Biomedical Applications
P. 233
Raman Detection of Car otenoids in Human T issue 209
(a)
4000
2000
1000
500
0
(b) 3600
Intensity
0.0
170 pixels
170 pixels
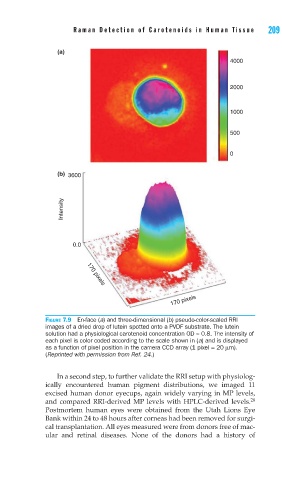
FIGURE 7.9 En-face (a) and three-dimensional (b) pseudo-color-scaled RRI
images of a dried drop of lutein spotted onto a PVDF substrate. The lutein
solution had a physiological carotenoid concentration OD ≈ 0.8. The intensity of
each pixel is color coded according to the scale shown in (a) and is displayed
as a function of pixel position in the camera CCD array (1 pixel = 20 μm).
(Reprinted with permission from Ref. 24.)
In a second step, to further validate the RRI setup with physiolog-
ically encountered human pigment distributions, we imaged 11
excised human donor eyecups, again widely varying in MP levels,
28
and compared RRI-derived MP levels with HPLC-derived levels.
Postmortem human eyes were obtained from the Utah Lions Eye
Bank within 24 to 48 hours after corneas had been removed for surgi-
cal transplantation. All eyes measured were from donors free of mac-
ular and retinal diseases. None of the donors had a history of