
Page 236 - Vibrational Spectroscopic Imaging for Biomedical Applications
P. 236
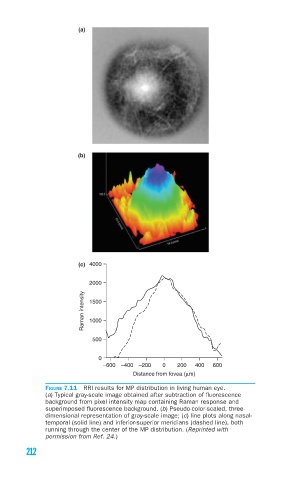
(a)


                 (b)


                 (c)  4000

                    2000
                   Raman intensity  1500


                    1000

                     500


                       0
                        –600 –400  –200  0   200  400  600
                                Distance from fovea (μm)
        FIGURE 7.11  RRI results for MP distribution in living human eye.
        (a) Typical gray-scale image obtained after subtraction of fl uorescence
        background from pixel intensity map containing Raman response and
        superimposed fl uorescence background. (b) Pseudo-color-scaled, three-
        dimensional representation of gray-scale image; (c) line plots along nasal-
        temporal (solid line) and inferior-superior meridians (dashed line), both
        running through the center of the MP distribution. (Reprinted with
        permission from Ref. 24.)
   212