
Page 241 - Vibrational Spectroscopic Imaging for Biomedical Applications
P. 241
Raman Detection of Car otenoids in Human T issue 217
10000
8000
4000
2000
10 mμ
100
(a)
10000
8000
Intensity (a.u.) 6000
4000
2000
0
0 20 40 60 80 100
mμ
(b)
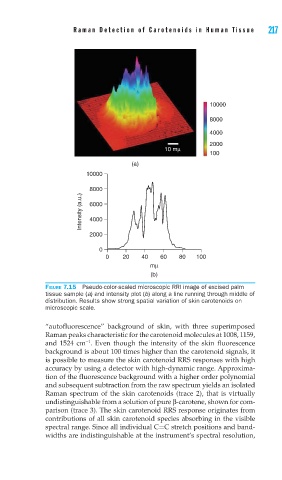
FIGURE 7.15 Pseudo-color-scaled microscopic RRI image of excised palm
tissue sample (a) and intensity plot (b) along a line running through middle of
distribution. Results show strong spatial variation of skin carotenoids on
microscopic scale.
“autofluorescence” background of skin, with three superimposed
Raman peaks characteristic for the carotenoid molecules at 1008, 1159,
−1
and 1524 cm . Even though the intensity of the skin fluorescence
background is about 100 times higher than the carotenoid signals, it
is possible to measure the skin carotenoid RRS responses with high
accuracy by using a detector with high-dynamic range. Approxima-
tion of the fluorescence background with a higher order polynomial
and subsequent subtraction from the raw spectrum yields an isolated
Raman spectrum of the skin carotenoids (trace 2), that is virtually
undistinguishable from a solution of pure β-carotene, shown for com-
parison (trace 3). The skin carotenoid RRS response originates from
contributions of all skin carotenoid species absorbing in the visible
spectral range. Since all individual C=C stretch positions and band-
widths are indistinguishable at the instrument’s spectral resolution,