
Page 242 - Vibrational Spectroscopic Imaging for Biomedical Applications
P. 242
218 Cha pte r Se v e n
Raman shift, cm –1
800 1000 1200 1400 1600 1800
200 1
160
Intensity, 10 4 counts 120 6 4 C-CH 3 C-C C=C
2
2
3
0
510 520 530 540
Wavelength, nm
(a) (b)
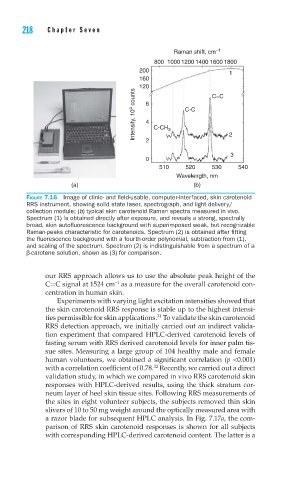
FIGURE 7.16 Image of clinic- and fi eld-usable, computer-interfaced, skin carotenoid
RRS instrument, showing solid state laser, spectrograph, and light delivery/
collection module; (b) typical skin carotenoid Raman spectra measured in vivo.
Spectrum (1) is obtained directly after exposure, and reveals a strong, spectrally
broad, skin autofl uorescence background with superimposed weak, but recognizable
Raman-peaks characteristic for carotenoids. Spectrum (2) is obtained after fi tting
the fl uorescence background with a fourth-order polynomial, subtraction from (1),
and scaling of the spectrum. Spectrum (2) is indistinguishable from a spectrum of a
β-carotene solution, shown as (3) for comparison.
our RRS approach allows us to use the absolute peak height of the
−1
C=C signal at 1524 cm as a measure for the overall carotenoid con-
centration in human skin.
Experiments with varying light excitation intensities showed that
the skin carotenoid RRS response is stable up to the highest intensi-
31
ties permissible for skin applications. To validate the skin carotenoid
RRS detection approach, we initially carried out an indirect valida-
tion experiment that compared HPLC-derived carotenoid levels of
fasting serum with RRS derived carotenoid levels for inner palm tis-
sue sites. Measuring a large group of 104 healthy male and female
human volunteers, we obtained a significant correlation (p <0.001)
32
with a correlation coefficient of 0.78. Recently, we carried out a direct
validation study, in which we compared in vivo RRS carotenoid skin
responses with HPLC-derived results, using the thick stratum cor-
neum layer of heel skin tissue sites. Following RRS measurements of
the sites in eight volunteer subjects, the subjects removed thin skin
slivers of 10 to 50 mg weight around the optically measured area with
a razor blade for subsequent HPLC analysis. In Fig. 7.17a, the com-
parison of RRS skin carotenoid responses is shown for all subjects
with corresponding HPLC-derived carotenoid content. The latter is a