
Page 243 - Vibrational Spectroscopic Imaging for Biomedical Applications
P. 243
Raman Detection of Car otenoids in Human T issue 219
40000
2
R = 0.91
Raman signal, counts 20000
R = 0.95
30000
10000
0
0.0 0.4 0.8 1.2 1.6
HPCL, μg/g
(a)
200
Number of subjects 100 N = 1,375
0
0 10 20 30 40 50 60 70
3
Skin carotenoid raman signal, 10 counts
(b)
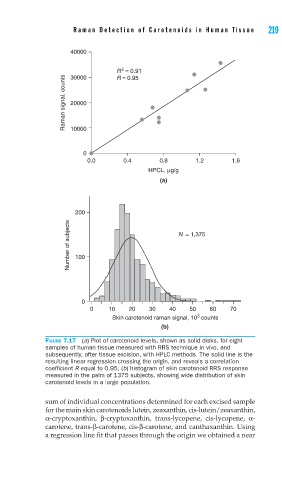
FIGURE 7.17 (a) Plot of carotenoid levels, shown as solid disks, for eight
samples of human tissue measured with RRS technique in vivo, and
subsequently, after tissue excision, with HPLC methods. The solid line is the
resulting linear regression crossing the origin, and reveals a correlation
coeffi cient R equal to 0.95; (b) histogram of skin carotenoid RRS response
measured in the palm of 1375 subjects, showing wide distribution of skin
carotenoid levels in a large population.
sum of individual concentrations determined for each excised sample
for the main skin carotenoids lutein, zeaxanthin, cis-lutein/zeaxanthin,
α-cryptoxanthin, β-cryptoxanthin, trans-lycopene, cis-lycopene, α-
carotene, trans-β-carotene, cis-β-carotene, and canthaxanthin. Using
a regression line fit that passes through the origin we obtained a near