
Page 305 - Vibrational Spectroscopic Imaging for Biomedical Applications
P. 305
Raman Imaging for Biomedical Applications in Clinics 279
0.20
Lipid
0.16
Glycogen
Intensity (a.u.) 0.08 Protein
0.12
0.04 DNA
RNA
0.00
600 800 1000 1200 1400 1600 1800
–1
Wavenumber (cm )
FIGURE 9.5 Spectra of the most prevalent biochemical components of cells (lipid,
glycogen, protein, DNA, and RNA) in the low wavenumber fi nger print region.
(Reproduced from Ref. 44, with permission of the Elsevier Limited publisher.)
0.05
Lipid
0.04
Glycogen
Protein
DNA
0.03
Intensity (a.u.) 0.02
RNA
0.01
0.00
2700 2800 2900 3000 3100
–1
Wavenumber (cm )
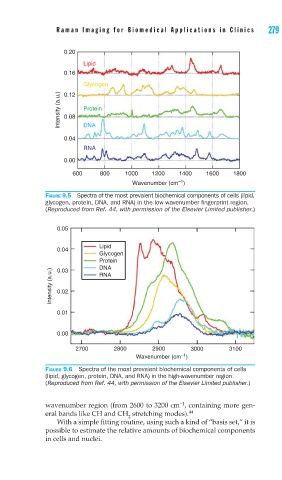
FIGURE 9.6 Spectra of the most prevalent biochemical components of cells
(lipid, glycogen, protein, DNA, and RNA) in the high-wavenumber region.
(Reproduced from Ref. 44, with permission of the Elsevier Limited publisher.)
−1
wavenumber region (from 2600 to 3200 cm , containing more gen-
eral bands like CH and CH stretching modes). 44
2
With a simple fitting routine, using such a kind of “basis set,” it is
possible to estimate the relative amounts of biochemical components
in cells and nuclei.