
Page 310 - Vibrational Spectroscopic Imaging for Biomedical Applications
P. 310
284 Cha pte r Ni ne
1100
812
716 757
A
2935
B
1460 1241 1100 812 757 716
C
1372 1090 835 683
3400 3200 3000 2800 1700 1500 1300 1100 900 700
–1
Raman Shift (cm )
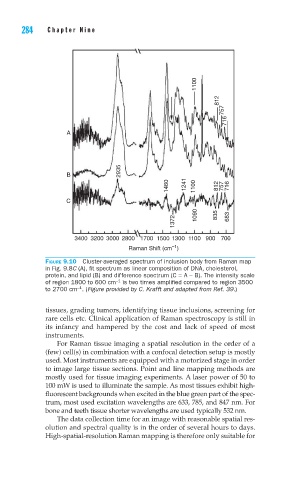
FIGURE 9.10 Cluster-averaged spectrum of inclusion body from Raman map
in Fig. 9.8C (A), fi t spectrum as linear composition of DNA, cholesterol,
protein, and lipid (B) and difference spectrum (C = A − B). The intensity scale
of region 1800 to 600 cm is two times amplifi ed compared to region 3500
−1
−1
to 2700 cm . (Figure provided by C. Krafft and adapted from Ref. 39.)
tissues, grading tumors, identifying tissue inclusions, screening for
rare cells etc. Clinical application of Raman spectroscopy is still in
its infancy and hampered by the cost and lack of speed of most
instruments.
For Raman tissue imaging a spatial resolution in the order of a
(few) cell(s) in combination with a confocal detection setup is mostly
used. Most instruments are equipped with a motorized stage in order
to image large tissue sections. Point and line mapping methods are
mostly used for tissue imaging experiments. A laser power of 50 to
100 mW is used to illuminate the sample. As most tissues exhibit high-
fluorescent backgrounds when excited in the blue green part of the spec-
trum, most used excitation wavelengths are 633, 785, and 847 nm. For
bone and teeth tissue shorter wavelengths are used typically 532 nm.
The data collection time for an image with reasonable spatial res-
olution and spectral quality is in the order of several hours to days.
High-spatial-resolution Raman mapping is therefore only suitable for